Core Web Vitals
LCP for loading, INP for responsiveness, CLS for stability: what each measures, the thresholds, the ratings, passing at the 75th percentile, and which browsers report them.
- 01Explain the three metricsSay what LCP, INP and CLS each measure, and how each one turns a whole visit into one number.
- 02Decide whether a page passesRate a value, find a 75th percentile, and say why a page passes only when all three are good at it.
- 03Measure them in your browserRead this page's own Core Web Vitals live, and know which browsers can report each one.
Three metrics, three experiences
Ravi looks after the website of Leaf and Kettle, the tea shop. Over the last few lessons, he has collected a pile of numbers: the load time, the first contentful paint (when the first text or image appears), and more. One morning, the shop's owner asks him a simple question: "Is our website good enough?"
Which of his numbers answer that question? And how small must each one be before it counts as "good enough"?
web.dev, Google's site for web developers, gives an answer. It picks three numbers, one for each of three experiences, and sets a target for each. Those three are the Core Web Vitals. In web.dev's words, they "apply to all web pages, should be measured by all site owners, and will be surfaced across all Google tools."
Here is Ravi's pile from one recorded visit to the slow store, with the three numbers web.dev picks:
Only three of the eight numbers answer the owner's question. On this visit, all three missed their targets.
Each of the three is a metric: a number that measures one thing about a page, the same way every time. Why these three? Think of a food guide checking a restaurant.
A food guide sends an inspector to a restaurant. The inspector could check a hundred things. The guide asks for just three: how soon the main course arrives, how quickly the waiter responds when you wave, and whether the table stays still while you eat. Each has a target. The restaurant does well only when it meets all three.
- In real life: How soon the main course arrives
- In web performance: LCP: how soon the page's main content is drawn
- In real life: How quickly the waiter responds when you wave
- In web performance: INP: how soon a click, tap or key press shows its result
- In real life: Whether the table stays still while you eat
- In web performance: CLS: how little the page jumps around
- In real life: Doing well only when all three are right
- In web performance: A page passes only when all three are good
Lesson 1.1's café could let you down in four ways. The inspector checks three of them. Each one gets a metric, with a long name and a short one:
- Loading: how soon the biggest text or picture you can see appears. Its metric is Largest Contentful Paint, or LCP. Good is 2.5 seconds or less.
- Responding: how soon a click, a tap or a key press shows its result. Its metric is Interaction to Next Paint, or INP. Good is 200 milliseconds or less.
- Staying still: how little things jump around. Its metric is Cumulative Layout Shift, or CLS. It's a score with no unit. Good is 0.1 or less.
The fourth way, smoothness, isn't one of the three. A millisecond (ms) is a thousandth of a second, so 200 ms is a fifth of a second.
Asha's visits ran into all three problems. Lesson 1.4 recorded a visit like hers: the course's slow store, on a laptop slowed down to behave like her phone. Then it clicked Add to cart once. Here is what the screen showed:
- Nothing drawn yet
0 ms to 3,092 msA blank screen
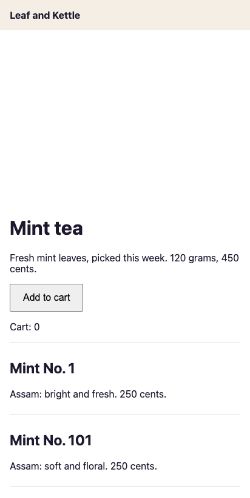
At 3,092 msText and teas, no picture yet
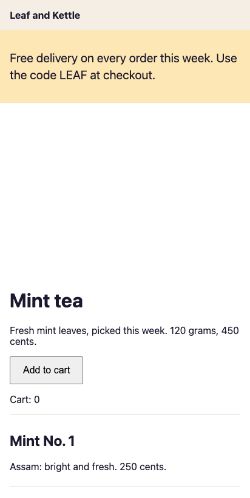
At 4,057 msA promotion pushes everything down
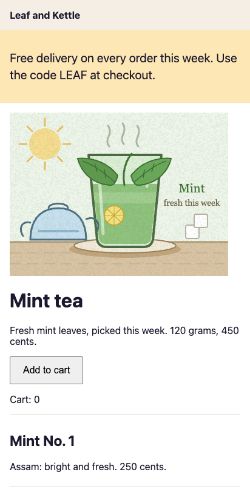
At 5,569 msThe picture arrives: the main content
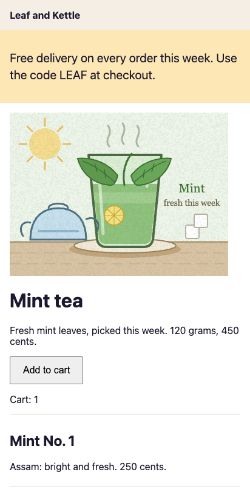
At 6,730 msAfter one click on Add to cart
Here are that visit's three numbers, each checked against its target:
// A visit like Asha's: the slow store, as Chrome recorded itconst lcp = 5568; // ms until the largest text or picture was drawnconst inp = 296; // ms from the click on Add to cart to the next frameconst cls = 0.1369; // a score for how much the page jumped console.log("Main content within 2.5 seconds?", lcp <= 2500);console.log("An answer to the click within 200 ms?", inp <= 200);console.log("A jump score of 0.1 or less?", cls <= 0.1);- Line 1 is a comment.
- Line 2 is the LCP: the picture of the tea, drawn 5,568 ms after the visit started.
- Line 3 is the INP. The click on Add to cart took 296 ms to show its result. It was the only click, so it's the INP.
- Line 4 is the CLS. The promotion's jump scored 0.1369.
- Lines 6 to 8 check each number against its target.
<=means "less than or equal to". - All three lines print
false:Main content within 2.5 seconds? false,An answer to the click within 200 ms? falseandA jump score of 0.1 or less? false.
So, for this visit, the honest answer to the owner is "not yet". The main picture came late, the click was slow, and the page jumped. But one visit isn't the whole website. The next sections take the metrics one at a time. Then the lesson comes back to the owner's question.
The Core Web Vitals are three metrics for three experiences: LCP for loading, INP for responding, and CLS for staying still. A page passes when each of the three is good for at least 3 of every 4 visits, counted separately for phones and for computers.
Largest Contentful Paint: 2.5 seconds
Start with loading. In lesson 1.1's café, the menu landing on your table was the first contentful paint. Your cup of tea arriving was the largest: the thing you came for. At the inspected restaurant, it's the main course.
Largest Contentful Paint (LCP) is the time from the start of the visit until the largest text or image you can see is drawn. Three words in that sentence need care:
- Paint means draw on the screen.
- Contentful means it's real content: text or a picture, not just a background colour.
- "You can see" means inside the viewport: the part of the page that fits on the screen right now, without scrolling.
web.dev lists the kinds of elements that count as content:
- an image: an
<img>, or an<image>inside an<svg>; - a video's poster image, or its first frame, whichever comes first;
- a background image loaded with CSS's
url(), but not a colour gradient; - a block of text, such as a heading or a paragraph.
The last candidate wins
A page doesn't draw everything at once. So the browser keeps track of the biggest piece of content drawn so far. Each time it draws something bigger, it reports a new candidate: a note saying "this is the largest so far, drawn at this time". The LCP is the last candidate.
It works like the leader board at a high-jump contest. Each better jump takes the top spot. The winner is whoever is on top when the contest ends.
// A page draws its heading first, and its big picture laterconst candidates = [ { at: 1200, what: "the heading" }, { at: 2100, what: "the picture" },]; const lcp = candidates.at(-1);console.log(`LCP: ${lcp.what}, at ${lcp.at} ms`);- Line 1 is a comment. The times are made up, to keep the example small.
- Lines 2 to 5 are the two candidates the browser reported. The heading came first, at 1200 ms. The picture is bigger, and came at 2100 ms.
- Line 7 takes the last candidate.
.at(-1)reads the last item of a list. - Line 8 prints
LCP: the picture, at 2100 ms.
When does the contest end? The browser stops reporting candidates as soon as the visitor taps, scrolls or presses a key. Those change what the person is looking at.
LCP's clock starts when the visit starts, not when the page's first byte arrives. So time spent on redirects and on connecting to the server counts too.
The thresholds for LCP
- Good is 2.5 seconds or less.
- Poor is over 4 seconds.
- In between, LCP needs improvement.
On the store visit, the LCP was the picture of the tea, at 5,568 ms. That's poor. Lesson 1.4 found why: a heavy picture, crossing a slow network.
Why it matters: until the LCP, the visitor can't see what they came for. To improve it, first find which element is the largest. That's the one to speed up.
Lessons 17.1 to 17.4 take LCP apart: How LCP works, The four parts of LCP, Load the LCP resource early and Remove render delay.
Interaction to Next Paint: 200 milliseconds
Now the page has loaded. Asha taps Add to cart. How long until the cart says 1?
During dinner, you wave at the waiter five times. Four times, they nod at once. Once, they don't look up for ages. When a friend asks how the service was, you don't work out an average. You tell them about the long wait.
- In real life: Each time you wave
- In web performance: An interaction: a click, a tap or a key press
- In real life: The waiter's nod
- In web performance: The next frame, showing the result
- In real life: Your wait, from the wave to the nod
- In web performance: The interaction's latency
- In real life: The longest wait of the evening
- In web performance: The visit's INP
Two words first:
- An interaction is one click with a mouse, one tap on a touch screen, or one press of a key. Hovering, scrolling and zooming aren't interactions for INP.
- An interaction's latency is the time from the input to the next frame. A frame is one still picture on the screen. The next frame is the browser's first chance to show that something happened.
Lesson 2.3 split that wait into three parts: the input delay, the processing, and the presentation delay. INP counts all three. The metric before it, First Input Delay, only counted the first.
One tap fires several events. An event is a signal the browser gives the page's code. A tap fires pointerdown, pointerup and then click. INP groups them into one interaction, and takes the longest as its latency.
The slowest interaction
A visit can have many interactions. Like the long wait for the waiter, INP reports the slowest:
// One visit, three interactions: ms from each input to the next frameconst latencies = [120, 340, 90]; const inp = Math.max(...latencies);console.log(`INP: ${inp} ms`);- Line 2 holds three latencies, in milliseconds.
- Line 4 finds the largest.
Math.maxgives back the biggest number it's given. The three dots,..., hand it the list's numbers one by one. - Line 5 prints
INP: 340 ms.
Why the slowest, and not the average? Because the slow one is the one people notice. web.dev says INP reports "a single value which all (or nearly all) interactions were beneath."
A long visit forgives a few slow moments
"Nearly all" matters on long visits. With hundreds of clicks, one random hiccup could decide the whole result. So INP skips the slowest interaction for every 50. A visit with 120 interactions skips its two slowest:
function inp(latencies) { const slowestFirst = [...latencies].sort((a, b) => b - a); const skip = Math.floor(latencies.length / 50); return slowestFirst[skip];} // A long visit: 118 quick clicks of 80 ms, and two slow onesconst longVisit = [...Array(118).fill(80), 900, 1500];console.log("120 interactions:", inp(longVisit), "ms");- Line 2 sorts the latencies, slowest first.
sort((a, b) => b - a)puts bigger numbers before smaller ones. - Line 3 works out how many to skip: one for every full 50.
Math.floorrounds down, so 120 ÷ 50 = 2.4 becomes 2. - Line 4 returns the latency at that position. Positions start at 0. So with nothing to skip, it returns the slowest.
- Line 8 makes a long visit.
Array(118).fill(80)is a list of 118 latencies of 80 ms. Then come two slow ones, 900 and 1500 ms. - Line 9 prints
120 interactions: 80 ms. Both slow ones were skipped.
web.dev says that "the vast majority of page experiences don't have over 50 interactions". So for most visits, INP is simply the slowest interaction.
The thresholds for INP
- Good is 200 ms or less.
- Poor is over 500 ms.
- In between, INP needs improvement.
A visit with no clicks, taps or key presses has no INP at all. The store visit had one click, so that click is its INP: 296 ms. That needs improvement. Lesson 1.4 found the cause. Each click rebuilt the whole list of teas, though only the cart had changed.
Why it matters: web.dev shows what a slow answer does. People click again, "thinking the experience is broken." A quick first frame, even one that only says "adding…", tells them the tap worked.
Lesson 11.4, Event Timing and INP, reads interactions from JavaScript and works out INP itself. The stage Responsiveness: INP, later in the course, is about making slow interactions fast.
Cumulative Layout Shift: 0.1
Back to the store visit. At 4,043 ms, a promotion appeared near the top of the page, under the header. Everything below it moved down: the heading, the button, the list of teas. The filmstrip's frame at 4,057 ms shows it.
You reach for your cup. Just then, someone tugs the tablecloth sideways, and your hand lands on the saucer instead. Nothing broke. But you had to look again and reach again. If you had moved the cup yourself, you wouldn't mind at all.
- In real life: The tablecloth sliding sideways
- In web performance: A layout shift: content moves between one frame and the next
- In real life: Your cup, now somewhere else
- In web performance: The text you were reading, or the button you were about to tap
- In real life: How much of the table slid, and how far
- In web performance: The shift's score
- In real life: Moving the cup yourself
- In web performance: A move right after your own click, tap or key press: it doesn't count
A layout shift is that tug. Something already on the screen moves to a new place between one frame and the next. The browser notices each shift and gives it a score.
How a shift is scored
The score multiplies two shares of the viewport:
- The impact fraction: how much of the viewport the moving content covers, before and after the move together.
- The distance fraction: how far it moved, as a share of the viewport's longer side.
Here is web.dev's example, as code:
// web.dev's example: a box filling half the viewport moves down by a quarter of itconst impact = 0.75; // before and after together, it covered 75% of the viewportconst distance = 0.25; // it moved by 25% of the viewport's height console.log("Layout shift score:", impact * distance);- Line 2 is the impact fraction. Before the move, the box covered half the viewport. After it, it covers another quarter. Together, that's 75%.
- Line 3 is the distance fraction. The box moved a quarter of the viewport's height, and height is the viewport's longer side.
- Line 5 multiplies them and prints
Layout shift score: 0.1875.
So a big block that moves far scores a lot. A small thing that moves a little scores very little.
Moves you asked for don't count
Not every move is bad. Press a button that opens a menu, and things move because you asked them to. So shifts within 500 ms of a click, a tap or a key press don't count. The browser marks them with hadRecentInput. Only clicks, taps and key presses earn this pass. Scrolling doesn't.
CLS keeps the worst burst
A long visit can have many small shifts, minutes apart. Adding them all up would punish a page just for being open a long time. So CLS groups shifts that come close together into bursts. Then it keeps the worst burst. Think of knocks to your table: three in a row feel like one bad moment, and another an hour later is a separate one.
// Two bursts of layout shifts on one visitconst firstBurst = 0.04 + 0.05; // two shifts, half a second apartconst secondBurst = 0.06; // one shift, 2.7 seconds later console.log("CLS:", Math.max(firstBurst, secondBurst).toFixed(2));console.log("All the shifts added up:", (firstBurst + secondBurst).toFixed(2));- Line 2 is the first burst: two shifts, half a second apart, scored 0.04 and 0.05.
- Line 3 is the second burst: one shift of 0.06, 2.7 seconds later.
- Line 5 keeps the larger burst and prints
CLS: 0.09.toFixed(2)shows two decimal places. - Line 6 adds everything up, to compare:
All the shifts added up: 0.15. That isn't CLS.
web.dev calls each burst a session window. Two rules decide where one window ends and the next begins:
- A gap of 1 second or more between two shifts starts a new window.
- A window can't be longer than 5 seconds. The next shift after that starts a new one.
Here are both rules as code, with the same three shifts:
function cls(shifts) { let worst = 0; let window = 0; let windowStart = 0; let last = -Infinity; for (const { at, score } of shifts) { if (at - last >= 1000 || at - windowStart >= 5000) { window = 0; windowStart = at; } window += score; last = at; worst = Math.max(worst, window); } return worst;} const shifts = [{ at: 800, score: 0.04 }, { at: 1300, score: 0.05 }, { at: 4000, score: 0.06 }];console.log("CLS:", cls(shifts).toFixed(2));- Lines 2 to 5 set up the largest window so far, the current window, when it started, and when the last shift came.
-Infinityis smaller than any number, so the first shift always starts a window. - Line 6 goes through the shifts in time order. Line 7 checks the two rules: a gap of 1000 ms, or a window 5000 ms long. Lines 8 and 9 start a new window.
- Line 11 adds the shift's score to the window. Line 12 notes its time. Line 13 keeps the largest window so far.
- Line 18 holds the shifts, at 800, 1300 and 4000 ms. Line 19 prints
CLS: 0.09.
The thresholds for CLS
- Good is 0.1 or less.
- Poor is over 0.25.
- In between, CLS needs improvement.
The store visit had one shift: the promotion, scored 0.1369. Nothing else came near it, so that one shift is the whole burst. Its CLS, about 0.14, needs improvement. Lesson 1.4 found the cause: the promotion arrived late, with no space kept for it.
Why it matters: keep space for content that arrives late. Then its arrival moves nothing, and nothing scores.
Lesson 11.3, Paint, LCP, and layout shift APIs, shows how to read these shifts from JavaScript.
Good, needs improvement, and poor
You've met all three metrics. Each one has two limits, and the two limits make three bands:
- up to the first limit: good;
- above it, up to the second: needs improvement;
- above the second: poor.
A limit like this is called a threshold. Each metric has two, so there are six in all. Each row of this table is one metric: what it measures, and when it's good or poor.
| Metric | What does it measure? | Good when | Poor when |
|---|---|---|---|
| Largest Contentful Paint (LCP) | Loading: when the largest text or picture you can see was drawn. | 2.5 seconds or less. | Over 4 seconds. |
| Interaction to Next Paint (INP) | Responding: the slowest click, tap or key press, from the input to the next frame. | 200 ms or less. | Over 500 ms. |
| Cumulative Layout Shift (CLS) | Staying still: the worst burst of layout shifts nobody asked for. | 0.1 or less. | Over 0.25. |
To rate a value, compare it with its metric's two thresholds:
const thresholds = { LCP: [2500, 4000], INP: [200, 500], CLS: [0.1, 0.25],}; function rate(metric, value) { const [good, poor] = thresholds[metric]; if (value <= good) return "good"; if (value <= poor) return "needs improvement"; return "poor";} console.log("LCP 2400 ms:", rate("LCP", 2400));console.log("INP 350 ms:", rate("INP", 350));console.log("CLS 0.3:", rate("CLS", 0.3));- Lines 1 to 5 hold the thresholds: LCP and INP in milliseconds, CLS as a score.
- Line 7 starts a function that rates one value. Line 8 picks its metric's two thresholds, and calls them
goodandpoor. - Line 9: a value up to the first threshold is good.
- Line 10: up to the second, it needs improvement. Line 11: anything above is poor.
- Lines 14 to 16 rate three values. They print
LCP 2400 ms: good,INP 350 ms: needs improvementandCLS 0.3: poor.
The course's pages, rated
Each row of this table is one page the course recorded in an earlier lesson: its LCP, its CLS, and its one click, if it had one.
| Page | LCP | CLS | One click |
|---|---|---|---|
| The slow store (Your toolkit) | 5,568 ms: poor | 0.14: needs improvement | 296 ms: needs improvement |
| The spinner page (Perceived performance) | 4,240 ms: poor | 0.07: good | No click recorded |
| The skeleton page (Perceived performance) | 4,236 ms: poor | 0: good | No click recorded |
| The content-first page (Perceived performance) | 2,236 ms: good | 0: good | No click recorded |
| The below-the-fold page (From onload to user-centric metrics) | 1,240 ms: good | 0: good | No click recorded |
What the table says:
- Only two pages had a good LCP: the content-first page and the below-the-fold page. Both drew their main content soon after the page arrived.
- The spinner page's shift was small enough to be good. The slow store's promotion wasn't.
None of these is a pass or a fail yet. Each is one load, in a lab, on one slowed-down laptop. Now measure the page you're reading:
observe("largest-contentful-paint", (entries) => { lcp = entries.at(-1).startTime;});observe("layout-shift", (entries) => { shifts.push(...entries.filter((shift) => !shift.hadRecentInput)); cls = largestSessionWindow(shifts);});observe("event", (entries) => { for (const entry of entries) if (entry.interactionId) keepLongest(latencies, entry); inp = slowestIgnoringOnePer50(latencies);});not yetnot yetnot yetReading this page's Core Web Vitals…
In the panel's code, observe asks the browser to hand over its records of one kind as they're written. Each record is an entry, like a line in a logbook.
- Line 2 keeps the last LCP entry: the last candidate.
- Line 5 keeps only the shifts without recent input. Press Shift a second later. Its banner arrives 1000 ms after your click, so it counts.
- Line 9 keeps the longest event of each interaction. Events that belong to one have an
interactionId. - Line 10 works out INP, as in the INP section.
Passing at the 75th percentile
Back to the owner's question: "Is our website good enough?" One visit can't answer it. Asha's phone is slow, but other visitors have fast laptops on Wi-Fi. Every visit gets its own three numbers. So which visits count?
A city wants to know if its buses are good enough. The timetable says a bus every 10 minutes. But the city doesn't judge the company by its timetable. It asks how long people really waited at the stops, every day, in rain and in rush hour. That's the wait that matters.
- In real life: The timetable: a bus every 10 minutes
- In web performance: A lab test: one load, on a machine and network you chose
- In real life: How long people really waited at the stops
- In web performance: Field data: numbers from real visits
- In real life: Rain, rush hour and the slow routes
- In web performance: Slow phones, busy networks and pages you didn't test
Field data is numbers from real visits, on visitors' own phones and networks. A lab test is a load you run yourself, like the course's recordings. web.dev says that "all of the Core Web Vitals are, first and foremost, field metrics."
INP shows why. A lab tool that only loads the page has nobody to click. In web.dev's words, such tools "cannot measure INP, as there is no user input." Lesson 3.3, Lab data vs field data, compares the two in depth.
So how do thousands of visits become one number for each metric? Not from the fastest visit, and not from the slowest. A school would put the rule like this:
Your school sets four tests this term. To pass, three of the four must be good. One bad day doesn't sink you. But one great test can't carry you either: most of your tests have to be good.
- In real life: Each test
- In web performance: One visit's value, like its LCP
- In real life: "Three of your four tests must be good"
- In web performance: At least 75% of visits must be good: the 75th percentile
- In real life: One bad day
- In web performance: A few unlucky visits on a flaky network
- In real life: One great test
- In web performance: Your fastest visit, or one good lab run
In numbers, that rule is a percentile. Line the visits up from fastest to slowest. The 75th percentile is the value three quarters of the way along: 75% of visits were that good or better. The median is the 50th percentile, the middle one.
function percentile(values, p) { const sorted = [...values].sort((a, b) => a - b); const rank = Math.ceil((p / 100) * sorted.length); return sorted[rank - 1];} const lcpLoads = [1400, 1700, 1900, 2000, 2200, 2300, 2600, 3900]; console.log("median LCP:", percentile(lcpLoads, 50), "ms");console.log("75th percentile LCP:", percentile(lcpLoads, 75), "ms");- Line 2 sorts the values, fastest first.
- Line 3 finds the position: 75% of 8 is 6.
Math.ceilrounds up, for lists where the answer isn't a whole number. - Line 4 takes the 6th value. Positions start at 0, so the 6th sits at position 5:
rank - 1. - Line 7 holds eight page loads' LCP, in milliseconds.
- Lines 9 and 10 print
median LCP: 2000 msand75th percentile LCP: 2300 ms.
2300 ms is under 2500, so this page's LCP is good at the 75th percentile. Six of its eight loads were good: exactly three quarters. The two slow ones, 2600 and 3900 ms, are the quarter that's allowed to miss, like one bad test out of four.
Why the 75th, and not the 95th?
web.dev chose the 75th percentile for two reasons, which pull in opposite directions:
- Most visits should meet the target. The percentile "should ensure that a majority of visits to a page or site experienced the target level of performance." At the 75th, at least 3 of every 4 did.
- A few unlucky visits shouldn't decide the result. With 100 visits, just 5 outliers can move the 95th percentile. It takes 25 to move the 75th.
When a page passes
Now the owner's question has a clear answer. web.dev says tools should count a page as passing "if it meets the recommended targets at the 75th percentile for all three of the Core Web Vitals metrics." Like the inspected restaurant, it needs all three. Two out of three isn't a pass.
Phones and computers are judged separately. web.dev measures the 75th percentile "segmented across mobile and desktop devices". So a page can pass on computers and fail on phones.
Where do these field numbers come from? Two places, both later in the course:
- Chrome collects them from real Chrome users, in the Chrome User Experience Report, or CrUX. Lesson 10.1, The Chrome User Experience Report, covers it.
- Your own pages can measure every visit and send the numbers home. Lesson 12.1, The web-vitals library, does it with a small library from Chrome's team.
Which browsers report each metric
To collect field data, the visitor's browser has to do the measuring. Each Core Web Vital comes from an API: a set of tools the browser gives your page's code. Each row is one metric, its API, and the first version of each browser that reports it, from MDN's data:
| Metric | API | Chrome | Firefox | Safari |
|---|---|---|---|---|
| LCP | Largest Contentful Paint API | 77 | 122 | 26.2 |
| INP | Event Timing, with interactionId | 96 | 144 | 26.2 |
| CLS | Layout Instability API | 77 | Not supported | Not supported |
Lesson 2.3 told how this came about. For years, only Chromium browsers could measure LCP and INP. Chromium is the browser code that Chrome and Edge are built on. With Safari 26.2, on December 12, 2025, every major browser engine could measure both.
CLS is still Chromium-only. So visitors on Firefox and Safari have no CLS in your data.
The browsers also stop the clock at slightly different moments. Chrome stops LCP when the frame is shown on the screen. Firefox and Safari stop a moment earlier, when painting ends. web.dev says this makes "slight milliseconds of difference", for INP too.
One more limit: CrUX, Chrome's own field data, only ever includes Chrome. Why it matters: to see your Safari and Firefox visitors' LCP and INP, measure on your own pages.
How the set changes over time
The three aren't fixed forever. web.dev says the metrics in the Core Web Vitals "will evolve over time". Lesson 2.3 showed the road a new metric takes: experimental, then pending for at least six months, then stable.
A stable Core Web Vital "won't change more than once per year", and each change is announced in its documentation and changelog. For example, on March 12, 2024, INP replaced First Input Delay.
What Google Search says about them
You'll hear that the Core Web Vitals decide your place on Google. Google's own words are more careful. Ranking is the order Google shows its results in. Google Search Central's page on page experience says:
- "Core Web Vitals are used by our ranking systems."
- Getting good results in its reports "doesn't guarantee that your pages will rank at the top of Google Search results".
- "Google Search always seeks to show the most relevant content, even if the page experience is sub-par."
That's lesson 1.2's shop window: what the page offers comes first. Google even warns that chasing a perfect score just for search "may not be the best use of your time". Why it matters: improve the Core Web Vitals for your visitors, like Asha. That's who they measure.
The system design lesson Core Web Vitals looks at designing for them from the start. Core Web Vitals in Next.js measures them in a Next.js app.
Rate each value
Each card below is one value. Compare it with its metric's two thresholds, then sort it into its band:
- LCP of 2.4 seconds
- LCP of 3.1 seconds
- LCP of 4.5 seconds
- INP of 180 ms
- INP of 300 ms
- INP of 650 ms
- CLS of 0.05
- CLS of 0.18
- CLS of 0.4
Sort each value as good, needs improvement or poor.
Common mix-ups
- "My Lighthouse run says LCP is good, so we pass." No. Passing is decided by real visits, at the 75th percentile. One lab run is one load, on one machine.
- "Two out of three is a pass." No. A page passes only when all three are good at the 75th percentile.
- "CLS adds up every shift on the page." No. It keeps the worst burst, the largest session window. Small shifts far apart don't pile up.
- "Content that moves after a click hurts CLS." No. Shifts within 500 ms of a click, a tap or a key press don't count.
- "INP is the average interaction." No. It's the slowest, skipping one for every 50.
- "Every browser reports all three." No. Firefox and Safari report LCP and INP, but not CLS.
- "Good Core Web Vitals put a page at the top of Google." No. Google's ranking systems use them, but Google says good results don't guarantee a top ranking. It always seeks to show the most relevant content.
Practice exercises
Answer first, then use the hints.
What does this print?
const thresholds = {
  LCP: [2500, 4000],
  INP: [200, 500],
  CLS: [0.1, 0.25],
};

function rate(metric, value) {
  const [good, poor] = thresholds[metric];
  if (value <= good) return "good";
  if (value <= poor) return "needs improvement";
  return "poor";
}

console.log(rate("CLS", 0.1));good. The thresholds are included in the band below them. So a CLS of 0.1 is good, and so are an LCP of 2,500 ms and an INP of 200 ms.
What does the last line print?
function inp(latencies) {
  const slowestFirst = [...latencies].sort((a, b) => b - a);
  const skip = Math.floor(latencies.length / 50);
  return slowestFirst[skip];
}

// A visit with 60 interactions: 57 quick ones, and three slow ones
const longVisit = [...Array(57).fill(80), 300, 900, 1500];
console.log("60 interactions:", inp(longVisit), "ms");60 interactions: 900 ms. With 60 interactions, INP skips one: the 1,500 ms one. The next slowest is 900 ms, which is poor.
What does this print?
function cls(shifts) {
  let worst = 0;
  let window = 0;
  let windowStart = 0;
  let last = -Infinity;
  for (const { at, score } of shifts) {
    if (at - last >= 1000 || at - windowStart >= 5000) {
      window = 0;
      windowStart = at;
    }
    window += score;
    last = at;
    worst = Math.max(worst, window);
  }
  return worst;
}

const shifts = [{ at: 800, score: 0.08 }, { at: 2000, score: 0.07 }];
console.log("CLS:", cls(shifts).toFixed(2));CLS: 0.08. Each shift has its own window, and CLS keeps the larger: 0.08, which is good. Added together, they would have been 0.15.
What is the 75th percentile LCP? Is it good?
function percentile(values, p) {
  const sorted = [...values].sort((a, b) => a - b);
  const rank = Math.ceil((p / 100) * sorted.length);
  return sorted[rank - 1];
}

const lcpLoads = [1200, 1500, 1800, 2000, 2100, 2300, 2400, 2500, 2700, 3200, 4100, 6000];

console.log("median LCP:", percentile(lcpLoads, 50), "ms");
console.log("75th percentile LCP:", percentile(lcpLoads, 75), "ms");2700 ms. That's over 2,500, so this LCP needs improvement, even though the median, 2,300 ms, is good. To fix it, speed up the slowest quarter of loads.
Which interaction type does DevTools name for your slow click?
pointer. DevTools groups the click's pointerdown, pointerup and click events into one pointer interaction. A key press would be a keyboard interaction.
Lesson 2.2's blank page, where Asha waited for her tea, had one layout shift. Download its trace and open it in DevTools. What rating does the shift's score get?
good. Its one shift scored a little under 0.1, so it's good, but only just. The skeleton page, with the same content, didn't move anything.
Check your understanding
For each question, ask: which experience does it measure, and how is the value worked out?
Question 1 of 8What does the second line of the rating example print?
Read the code, then predictconst thresholds = { LCP: [2500, 4000], INP: [200, 500], CLS: [0.1, 0.25], }; function rate(metric, value) { const [good, poor] = thresholds[metric]; if (value <= good) return "good"; if (value <= poor) return "needs improvement"; return "poor"; } console.log("LCP 2400 ms:", rate("LCP", 2400)); console.log("INP 350 ms:", rate("INP", 350)); console.log("CLS 0.3:", rate("CLS", 0.3));Choose an answer to see the explanation.
Question 2 of 8Which interactions does INP look at?
Choose an answer to see the explanation.
Question 3 of 8What does the session window example print?
Read the code, then predictfunction cls(shifts) { let worst = 0; let window = 0; let windowStart = 0; let last = -Infinity; for (const { at, score } of shifts) { if (at - last >= 1000 || at - windowStart >= 5000) { window = 0; windowStart = at; } window += score; last = at; worst = Math.max(worst, window); } return worst; } const shifts = [{ at: 800, score: 0.04 }, { at: 1300, score: 0.05 }, { at: 4000, score: 0.06 }]; console.log("CLS:", cls(shifts).toFixed(2));Choose an answer to see the explanation.
Question 4 of 8What does it mean for a page's LCP to be good at the 75th percentile?
Choose an answer to see the explanation.
Question 5 of 8Why did web.dev choose the 75th percentile, and not the 95th?
Choose an answer to see the explanation.
Question 6 of 8Why can't a lab tool like Lighthouse measure INP on its own?
Choose an answer to see the explanation.
Question 7 of 8Which browsers can report CLS from JavaScript?
Choose an answer to see the explanation.
Question 8 of 8In the course's recorded loads, which pages had a good LCP?
Choose an answer to see the explanation.
Key takeaways
- LCP is for loading: when the largest text or picture you can see was drawn. Good within 2.5 seconds, poor over 4.
- INP is for responding: the slowest interaction, skipping one for every 50. Good within 200 ms, poor over 500.
- CLS is for staying still: the worst burst of unexpected shifts. Good at 0.1 or less, poor over 0.25.
- A page passes when all three are good at the 75th percentile of real visits, for phones and computers separately.
- Every major browser reports LCP and INP. Only Chromium browsers report CLS.
- The set changes slowly, with notice, at most once a year. Google's ranking systems use it, but a good score doesn't guarantee a top place.
Remember the one-liner.
Main content within 2.5 seconds, every answer within 200 ms, almost no jumping, for 3 of every 4 visits.
Sources
The facts on this page come from these docs and specifications:
- Web Vitals, web.dev.
- Largest Contentful Paint (LCP), web.dev.
- Interaction to Next Paint (INP), web.dev.
- Cumulative Layout Shift (CLS), web.dev.
- Optimize Cumulative Layout Shift (shifts after input), web.dev.
- Defining the Core Web Vitals metrics thresholds, web.dev.
- LargestContentfulPaint, PerformanceEventTiming.interactionId and LayoutShift, MDN.
- LCP and INP are now Baseline Newly available, web.dev.
- Interaction to Next Paint is officially a Core Web Vital, web.dev.
- Understanding page experience in Google Search results, Google Search Central.
- Performance features reference: interactions and layout shifts, Chrome for Developers.
Coming next: The supporting metrics, also in Why speed matters. It covers TTFB, FCP, Total Blocking Time and Speed Index: what each tells you, and when to look at it.