The supporting metrics
TTFB, FCP, Total Blocking Time and Speed Index: what each tells you about a Core Web Vital, custom metrics with User Timing, and the metrics to stop quoting.
- 01Use each metric to explain a vitalSay which step of a load TTFB, FCP, TBT and Speed Index time, which Core Web Vital each helps explain, and where you can measure it.
- 02Work out TBT and know its limitsAdd up blocking time from long tasks the way Lighthouse does, and say what TBT can and can't tell you about INP.
- 03Measure what your product cares aboutTime your own moments with performance.mark() and performance.measure(), and know which numbers to stop quoting.
The metrics behind the vitals
It's a busy morning. Asha opens Leaf and Kettle's Mint tea page on her phone, as she does most days. Today, the screen stays white. She waits. Then the words appear. A moment later, the picture of the tea appears too.
Nothing is broken. The shop's server, the computer that sends out the page, is having a slow morning. It waits 1,500 ms, a second and a half, before it answers.
The course recorded this slow morning on purpose. It loaded the tea shop page from lesson 1.1 again, the same way: in Chrome 156, with the network and the computer slowed down to behave like a phone. The only change was the server's wait. Here is what Asha saw, and when:
// The slow morning, in milliseconds from the moment Asha opened the page.const firstByte = 1502;const words = 2156;const picture = 2316; console.log(`Until ${firstByte} ms, not one byte of the page had arrived.`);console.log(`The words appeared at ${words} ms.`);console.log(`The picture appeared at ${picture} ms.`);- Line 1 is a comment. Every time is in milliseconds (ms), counted from the moment Asha opened the page. A millisecond is a thousandth of a second.
- Line 2 is when the first byte of the page reached her phone. A byte is a tiny piece of data, about one letter of text. This page's main file alone is 846 bytes.
- Line 3 is when the words appeared on the screen. Line 4 is when the picture of the tea appeared.
- Lines 6 to 8 print them as sentences:
Until 1502 ms, not one byte of the page had arrived.,The words appeared at 2156 ms.andThe picture appeared at 2316 ms.
Read the picture from left to right. For the first 1,502 ms, Asha saw a blank screen, and not one byte had arrived. Everything she saw came after that.
Now look at the same morning the way Ravi does. He looks after the shop's website. In the last lesson, the owner asked him: "Is our website good enough?" He answered with the three Core Web Vitals. One of them is LCP, Largest Contentful Paint: when the main content appears. Here, that's the picture of the tea:
// The page's LCP on two mornings, in milliseconds.const usualMorning = 1396;const slowMorning = 2316; console.log(`LCP got ${slowMorning - usualMorning} ms slower.`);console.log(slowMorning <= 2500 ? "LCP is still good." : "LCP is no longer good.");- Line 2 is the usual morning's LCP, from lesson 1.1's recording. Line 3 is the slow morning's.
- Line 5 subtracts one from the other and prints
LCP got 920 ms slower. - Line 6 checks the slow morning against LCP's good limit, 2,500 ms, from lesson 3.1. The
? :picks the first text when the check is true, and the second when it isn't. It printsLCP is still good.
So the main content came almost a second later, and the page still passed. What LCP can't tell Ravi is why. Was it the picture? The network? A script? The server? Why it matters: you can't fix a slow page until you know which step got slow.
You're driving, and the car won't go faster than 60. The speedometer shows you the problem. It doesn't show you the cause. So you glance at the smaller gauges. The temperature needle is in the red: the engine is too hot. Now you know what to fix.
- In real life: The speedometer, the main dial
- In web performance: The Core Web Vitals: LCP, INP and CLS
- In real life: The temperature and fuel gauges
- In web performance: The supporting metrics: TTFB, FCP, TBT and Speed Index
- In real life: A needle in the red
- In web performance: The metric that shows where the time went, like a late first byte
The supporting metrics are those smaller gauges. Each one times one step on the way to a Core Web Vital. You met some of them in lesson 2.3. There are four:
- Time to First Byte (TTFB): when the first byte of the page arrives. It's the second screen in the picture.
- First Contentful Paint (FCP): when the first text or picture is drawn. It's the third screen.
- Total Blocking Time (TBT): how long the page was too busy to answer a tap while it loaded. The long task in the picture adds to it.
- Speed Index: how quickly the screen fills in, from lesson 2.3.
Each row of this table is one supporting metric: what it measures, which Core Web Vital it helps explain, and where you can measure it. The lab means a test you run yourself, like the course's recordings. The field means real visits, on visitors' own phones.
| Metric | What does it measure? | Which vital does it help explain? | Where can you measure it? |
|---|---|---|---|
| Time to First Byte (TTFB) | How long until the first byte of the page's HTML arrives. | LCP and FCP. Nothing can be drawn before the HTML arrives. | In the lab and in the field. |
| First Contentful Paint (FCP) | When the first text or picture is drawn. | LCP. The main content can't come before the first content. | In the lab and in the field. |
| Total Blocking Time (TBT) | How long the page's long tasks kept it from answering a tap while it loaded. | INP. While the main thread is busy, a tap has to wait. | In the lab. web.dev advises against measuring it in the field. |
| Speed Index | How quickly the screen fills in. | LCP. It shows how much of the page appeared before the main content. | Only in the lab, because it needs a video of the load. |
The Core Web Vitals tell you how a visit went. The supporting metrics tell you why. They aren't pass-or-fail on their own. Use them to find the step that made LCP or INP slow. When no standard metric times the moment you care about, add your own.
Time to First Byte
Back to Ravi's question: where did the extra 920 ms come from? Start at the very beginning. Before a phone can draw anything, the page has to start arriving. How long did Asha's phone wait for that?
You phone a restaurant to order dinner. It rings, and rings. Two minutes later, someone picks up. After that, the cooking and the delivery take as long as they always do. But your food still arrives two minutes late.
- In real life: Looking up the number and dialling
- In web performance: DNS, the connection and TLS: reaching the server
- In real life: The phone ringing and ringing
- In web performance: Waiting for the server
- In real life: The first "Hello, how can I help?"
- In web performance: The first byte of the page's HTML: where TTFB ends
- In real life: The food arriving at your door, two minutes late
- In web performance: LCP, pushed back by the late first byte
Time to First Byte (TTFB) is the time from the start of the visit until the first byte of the page's HTML arrives. The HTML is the page's main file. It holds the text, and it names every other file the page needs: styles, scripts and pictures. Until it starts arriving, the browser has nothing to work with.
Here is the first byte on both mornings:
// When the first byte of the page arrived, in milliseconds.const usualMorning = 2;const slowMorning = 1502; console.log(`The first byte came ${slowMorning - usualMorning} ms later.`);- Lines 2 and 3 hold the two recorded times. On the usual morning, the first byte came after just 2 ms. The course's server runs on the same computer as the browser, so the answer had almost no distance to travel.
- Line 5 prints
The first byte came 1500 ms later.
That's the server's whole wait: the needle in the red. Why it matters: when TTFB jumps, look at the server, and the steps to reach it, before you change the page itself.
What TTFB adds up
On a real website, the first byte waits for more than the server. web.dev lists the steps TTFB adds up. The main ones are:
- Redirects: the first address answers "the page has moved, go here instead", and the browser asks again.
- DNS: turning a name like completefrontend.com into the server's number, its IP address. Like looking up a phone number.
- Connection: opening a line to the server. Like dialling.
- TLS: agreeing on a secret code with the server, so nobody in between can read the page. It's the S in HTTPS.
- Waiting for the server: the request travels to the server, the server builds its answer, and the first byte travels back.
Here they are as code, with made-up times:
const phases = { redirect: 0, dnsLookup: 60, connection: 150, tls: 150, waitingForServer: 400,}; const ttfb = Object.values(phases).reduce((total, ms) => total + ms, 0);console.log("TTFB:", ttfb, "ms");console.log(ttfb <= 800 ? "good" : ttfb <= 1800 ? "needs improvement" : "poor");- Lines 2 to 6 are the five steps, in milliseconds. This visit had no redirect, so line 2 is 0.
- Line 9 adds them up.
Object.valueslists the five numbers, andreduceadds them one by one. Line 10 printsTTFB: 760 ms. - Line 11 rates it and prints
good.
web.dev gives TTFB these limits:
- Good is 0.8 seconds (800 ms) or less.
- Poor is over 1.8 seconds.
- In between, it needs improvement.
The slow morning's TTFB, 1,502 ms, needs improvement. But web.dev calls these limits a "rough guide", because TTFB isn't a Core Web Vital. A page doesn't have to meet them, as long as its Core Web Vitals do well.
Lesson 5.1, The navigation timeline, times each of these steps in a real visit. Lesson 14.1, Time to first byte, shows how to make them shorter.
Everything after the first byte moves too
When the first byte is late, what happens to the rest? Here are three moments on both mornings:
// Three moments on two mornings, in milliseconds.const moments = [ ["The whole HTML", 582, 1512], ["The first words", 1240, 2156], ["The picture", 1396, 2316],]; for (const [name, usual, slow] of moments) { console.log(`${name} came ${slow - usual} ms later.`);}- Lines 2 to 6 list three moments. Each row holds a name, the usual morning's time, and the slow morning's time.
- Line 3 is when the whole HTML had arrived. Line 4 is when the first words appeared. Line 5 is when the picture appeared.
- Line 8 goes through the rows one at a time. Line 9 subtracts the usual time from the slow one.
- It prints
The whole HTML came 930 ms later.,The first words came 916 ms later.andThe picture came 920 ms later.
All three moved by about the same amount. The browser can't ask for the styles or the picture until the HTML names them. So when the HTML is late, everything after it is late by the same amount, like the takeaway. Why it matters: speed up the server, and FCP and LCP come sooner with it.
Why 930 ms, and not 1,500?
The first byte came 1,500 ms later, but the whole HTML only 930 ms later. The reason is how the lab slows the network down. The course used DevTools' Slow 4G setting. It holds back the rest of each answer, not its first byte. On the usual morning, the first byte came at 2 ms, and the rest of the HTML at 582 ms. On the slow morning, that hold-up happened while the server was still waiting, so the two overlapped.
On a real network, the trip to the server comes before the first byte, so a server's wait adds to it. Lighthouse's docs explain that real mobile networks delay each small piece of data, called a packet, not each whole request. Why it matters: in a lab slowed down this way, TTFB shows mostly your server's own time. The next lesson looks at more ways the lab and real visits differ.
Reading TTFB in the page
A page can read its own TTFB. For each visit, the browser keeps a list of times called the navigation entry. Its responseStart is when the first byte arrived:
const [navigation] = performance.getEntriesByType("navigation");const ttfb = navigation.responseStart - navigation.startTime;console.log(ttfb > 0 ? "the first byte arrived after the navigation started" : "no navigation timing");- Line 1 gets the navigation entry.
getEntriesByType("navigation")gives back a list with one entry, and the square brackets take it out. - Line 2 subtracts when the visit started,
startTime, from when the first byte came,responseStart. Line 3 prints a sentence when the result is above 0.
First Contentful Paint
The first byte came at 1,502 ms. But Asha's screen stayed white for a while longer. When did she first see something?
You knock on a friend's door. For a while, nothing happens. Then you hear the key turn in the lock. You can't see your friend yet. But you relax: someone is coming.
- In real life: Waiting on the doorstep
- In web performance: The white screen
- In real life: The key turning in the lock
- In web performance: FCP: the first text or picture is drawn
- In real life: Your friend, standing in front of you
- In web performance: LCP: the main content is drawn
- In real life: You can't see your friend before the key turns
- In web performance: LCP can't come before FCP
First Contentful Paint (FCP) is the time from the start of the visit until the browser first draws any content. To paint means to draw on the screen. Content, for FCP, means one of these:
- text;
- an image, including a background image;
- an
<svg>drawing; - a
<canvas>, a box that scripts draw on, once it isn't plain white.
A background colour on its own doesn't count. FCP answers lesson 2.3's first question: "Is it happening?" Here is the slow morning, as Chrome 156 saved it:
- Nothing drawn yet
0 ms to 2,157 msA blank screen
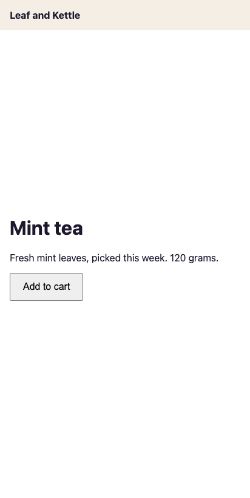
At 2,157 msThe words: FCP
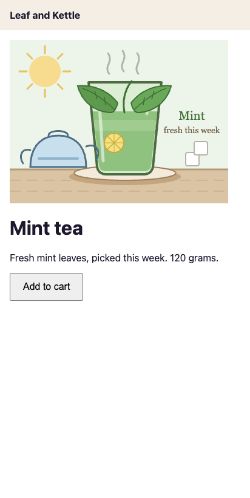
At 2,316 msThe picture: LCP
The first frame is FCP: the key has turned. The second is LCP: your friend is in front of you. FCP splits the wait in two, before Asha saw anything and after:
// The slow morning, in milliseconds.const firstByte = 1502;const fcp = 2156;const lcp = 2316; console.log(`From the first byte to FCP: ${fcp - firstByte} ms`);console.log(`From FCP to LCP: ${lcp - fcp} ms`);- Lines 2 to 4 hold three recorded times: the first byte, FCP and LCP.
- Line 6 prints
From the first byte to FCP: 654 ms. That's the time it took to fetch the files the page needed before it could draw. - Line 7 prints
From FCP to LCP: 160 ms. Once the words were drawn, the picture was close behind.
So most of the slow morning's wait came before FCP: 2,156 ms of 2,316 ms. Why it matters: when FCP is late, look at the steps before the first paint. When FCP is early but LCP is late, look at the main content itself.
web.dev gives FCP these limits:
- Good is 1.8 seconds or less.
- Poor is over 3 seconds.
- In between, it needs improvement.
The slow morning's FCP, 2,156 ms, needs improvement. What holds FCP back? Two kinds of step:
- Everything before the first byte. web.dev points out that FCP includes redirects, connection setup and TTFB.
- Files the page needs before it can draw. On the slow morning, the words appeared just after the stylesheet,
styles.css, arrived at 2,112 ms. Lesson 1.4's slow store had a script in its<head>, which the browser had to fetch and run before drawing. Its FCP was 3,092 ms: poor.
LCP can never come before FCP, just as you can't see your friend before the key turns. They can be the same moment, though. On lesson 2.3's below-the-fold page, both were 1,240 ms: the largest text was drawn in the very first paint. Lesson 5.3, Render-blocking and parser-blocking resources, shows how to stop files holding back the first paint.
Total Blocking Time as a lab stand-in for INP
Look at the picture of Asha's screen again. Between the words and the picture, there was a long task: 147 ms, starting at 2,160 ms. What was it, and would Asha have noticed?
It was the page's script, app.js, doing its start-up work: sorting 200,000 prices. Lesson 1.1 found that the Add to cart button only worked once this script had finished. So a tap during those 147 ms would have waited.
Three words help here. You met them in lessons 1.1 and 2.3:
- The main thread is the one worker that runs the page's JavaScript, handles taps and draws the page. It does one thing at a time.
- A task is one piece of work on the main thread, like running a script or handling a click.
- A long task is a task that takes more than 50 ms.
Lesson 3.1 measured how quickly a page answers with INP, Interaction to Next Paint. But INP needs a real person tapping, and a lab test only loads the page. So the lab looks for the long tasks that would make taps wait. That's Total Blocking Time (TBT). It's a stand-in for INP: it takes INP's place in the lab.
The tea shop's cashier is alone at the till during the morning rush. The phone keeps ringing, and she answers every call. Nobody in the queue minds a one-minute call. But on a long call, the queue stands still until she hangs up. After the rush, the owner adds up the extra minutes of every long call.
- In real life: The cashier, alone at the till
- In web performance: The main thread: one worker, one job at a time
- In real life: A phone call
- In web performance: A task
- In real life: The first minute of each call, which nobody minds
- In web performance: The first 50 ms of each task
- In real life: The rest of a long call, while the queue waits
- In web performance: The task's blocking time
- In real life: All those extra minutes, added up over the morning rush
- In web performance: TBT, added up from FCP to TTI
web.dev explains the rule: the browser "cannot interrupt a task that's in progress". A tap that comes during a long task waits for it to end. And a wait of over 50 ms is one people are likely to notice. So for each long task, the part over 50 ms is its blocking time:
// A task's blocking time is the part over 50 ms.function blockingTime(taskMs) { return Math.max(0, taskMs - 50);} console.log(`A 147 ms task blocks for ${blockingTime(147)} ms.`);console.log(`A 40 ms task blocks for ${blockingTime(40)} ms.`);- Line 1 is a comment. Lines 2 to 4 are a function that takes a task's length in milliseconds.
- Line 3 takes 50 away.
Math.max(0, …)gives back the bigger of two numbers, so the answer never drops below 0. - Line 6 uses the slow morning's long task. It prints
A 147 ms task blocks for 97 ms. - Line 7 tries a short task. It prints
A 40 ms task blocks for 0 ms.It isn't a long task, so it doesn't block.
Total Blocking Time adds up the blocking time of every long task while the page loads. The slow morning had one long task, so its TBT was 97 ms.
Only the loading part counts
Lighthouse, Google's page-testing tool from lesson 2.3, only counts the part of each task between two moments:
- FCP, the first paint. Before it, there's no content on the screen yet.
- TTI, Time to Interactive, from lesson 2.3: the end of the last long task before 5 quiet seconds.
A task that starts before FCP only counts from FCP. A task that runs past TTI only counts up to TTI. Here is the whole calculation, with made-up times:
function totalBlockingTime(tasks, fcp, tti) { let total = 0; for (const task of tasks) { const start = Math.max(task.start, fcp); const end = Math.min(task.start + task.duration, tti); const length = end - start; if (length >= 50) total += length - 50; } return total;} const tasks = [ { start: 900, duration: 120 }, { start: 1500, duration: 60 }, { start: 2200, duration: 300 },];console.log("TBT:", totalBlockingTime(tasks, 1000, 2400), "ms");- Line 4 moves a task's start up to FCP if it began earlier. Line 5 moves its end back to TTI if it ran later.
- Line 6 measures what's left. Line 7 adds the part over 50 ms to the total.
- Lines 12 to 16 are three tasks. Line 17 puts FCP at 1,000 ms and TTI at 2,400 ms.
- It prints
TBT: 160 ms. The first task has only 20 ms after FCP, so it blocks nothing. The second blocks 10 ms. The third, cut at TTI, blocks 150 ms.
Lighthouse rates TBT on phones like this:
- Fast is up to 200 ms.
- Moderate is 200 to 600 ms.
- Slow is over 600 ms.
Each row of this table is one of the course's recorded loads: when its FCP came, its long tasks, and its TBT, worked out the same way.
| Page | When was FCP? | Which long tasks did it have? | What was its TBT? |
|---|---|---|---|
| The slow morning (this lesson) | 2,156 ms | 147 ms at 2,160 ms | 97 ms: good |
| The tea shop (What is web performance?) | 1,240 ms | 143 ms at 1,245 ms | 93 ms: good |
| The heavy page (Why performance matters) | 1,220 ms | 213 ms at 4,406 ms | 163 ms: good |
| The shop on a mid-range phone (The performance inequality gap) | 1,204 ms | 155 ms at 2,037 ms | 105 ms: good |
| The shop on a low-end phone (The performance inequality gap) | 4,204 ms | 366 ms at 7,234 ms | 316 ms: needs improvement |
| The slow store (Your toolkit) | 3,092 ms | 145 ms at 2,894 ms, 204 ms at 5,271 ms | 154 ms: good |
| The below-the-fold page (From onload to user-centric metrics) | 1,240 ms | 257 ms at 4,413 ms | 207 ms: needs improvement |
Three rows stand out:
- The low-end phone had the longest task, 366 ms, and the only TBT over 300 ms. A slower phone turns the same script into a longer task.
- The slow store's TBT was 154 ms, though lesson 1.4 counted 249 ms of blocking for the whole load. One of its two long tasks didn't count. The exercises ask you to find which.
- The slow store's TBT was good. Yet its Add to cart click took 296 ms, which needs improvement as an INP. The click came after the load, so TBT never saw it.
That's why TBT is only a stand-in. web.dev says a low TBT often goes with a low INP. But TBT can flag problems nobody meets, if nobody taps at that moment. And it can miss problems that taps themselves cause. Why it matters: use TBT in the lab to catch heavy scripts early, and INP from real visits to judge how the page answers.
Now try it yourself. This playground runs 300 ms of real work on this page's main thread, split in different ways:
function runPlan({ tasks, ms }) { for (let i = 0; i < tasks; i++) { setTimeout(() => busyFor(ms), i * (ms + 20)); }} new PerformanceObserver((list) => { for (const task of list.getEntries()) blocking += Math.max(0, task.duration - 50);}).observe({ type: "longtask" });Nothing run yet.
Pick a way to split 300 ms of work, then press Run. Try all four. The work is the same each time. The blocking time isn't.
In the panel's code:
- Line 3 starts each task, with 20 ms free between tasks for the browser to handle taps.
- Line 8 adds up each long task's time over 50 ms, the way TBT does.
Short tasks are the cashier keeping every call short. Lesson 6.2, The event loop and frames, shows why a long task freezes everything. Lesson 6.4, The cost of JavaScript, shows where long tasks come from.
Speed Index
Lesson 2.3 pictured two people painting the same fence. They finish at the same time. One paints nearly all of it at the end. The other paints a little at a time. Speed Index counts how much fence stayed bare, and for how long. For a page, it adds up how much of the screen was still missing, over time. Lower is better.
The slow morning's Speed Index was 2,277 ms. The screen was blank until 2,157 ms. Then the words made it about a quarter complete, by the recorder's colour count, until the picture finished it 159 ms later. So the Speed Index is close to the LCP, 2,316 ms: the words and the picture came close together.
Lighthouse rates Speed Index on phones as fast up to 3.4 seconds, and slow over 5.8 seconds. Lesson 2.3 found its two limits. It needs a video of the load, so it works only in the lab. And it counts grey placeholder boxes as progress.
So when is it worth a look? When you change a page and want to compare the two versions, in the same lab, tested the same way. If the new version fills the screen sooner, its Speed Index drops. To judge a page on its own, use LCP.
Custom metrics for your own product
Every metric so far works the same way on every website. But Leaf and Kettle has a search box. How long does it take to show results? No standard metric knows. So Ravi can make his own: a custom metric.
The food guide from the last lesson checks three things at every restaurant. But one café is famous for its soufflé. So the cook keeps her own timer. She starts it when the soufflé goes in the oven, and stops it when it reaches the table. No inspector asks for that number. It's the one her café cares about most.
- In real life: The inspector's three checks
- In web performance: The Core Web Vitals: the same for every website
- In real life: Starting the timer as the soufflé goes in
- In web performance:
performance.mark("search-start") - In real life: Stopping it at the table
- In web performance:
performance.mark("search-end") - In real life: The time on the timer
- In web performance:
performance.measure(...): the time between the two marks
To time your own moments, the browser gives you the User Timing API. An API is a set of functions the browser offers your code. This one has two:
performance.mark(name)writes down the time right now, with a name. That's a mark.performance.measure(name, start, end)works out the time between two marks. That's a measure.
function searchTeas(word) { const teas = Array.from({ length: 50000 }, (_, i) => `tea ${i}`); return teas.filter((tea) => tea.includes(word));} performance.mark("search-start");const found = searchTeas("42");performance.mark("search-end"); const measure = performance.measure("search", "search-start", "search-end");console.log(measure.name, "found", found.length, "teas");console.log(measure.duration >= 0 ? "measured" : "not measured");- Lines 1 to 4 are the work to time. The function makes 50,000 tea names and keeps the ones that contain a word.
- Line 6 marks the moment before the search. Line 8 marks the moment after it.
- Line 10 measures between the two marks, and names the measure
search. - Line 11 prints
search found 2475 teas. Line 12 printsmeasured. The time itself depends on your device, so the example doesn't print it.
Marks and measures show up in DevTools' Performance panel, in a row called the Timings track. A PerformanceObserver, the browser's way of telling your code about new timings, can collect them for your own analytics.
Try it. This playground marks your click on Search. It marks again once the results are on the screen, in the next frame: the next still picture the screen shows.
searchButton.addEventListener("click", () => { performance.mark("search-start"); const found = searchTeas(box.value); showResults(found); requestAnimationFrame(() => setTimeout(() => { performance.mark("results-shown"); performance.measure("search to results", "search-start", "results-shown"); }));});No measures yet.
Type part of a tea's name, such as 42, and press Search. The panel searches 200,000 tea names. It measures from your click to the frame that shows the results.
In the panel's code:
- Line 2 marks the click.
- Line 5 waits for the frame that shows the results. Lines 6 and 7 then mark that moment and measure from the click.
For a picture or a block of text, Chromium browsers have one more tool: Element Timing. You add an elementtiming attribute to the element. The browser then reports when that element was drawn. web.dev explains that the LCP API is built on top of Element Timing.
Lesson 11.6, User Timing and custom metrics, goes further with marks, measures and Element Timing.
Metrics you should stop quoting
Some numbers still turn up in reports and meetings, but they mislead. To quote a metric here means to give it as your answer to "how fast is the site?". Each row of this table is one metric to stop quoting, why, and what to quote instead:
| Metric | Why stop quoting it? | What to quote instead |
|---|---|---|
| Page load time (the load event) | It tracks the page's own files, not what people see. It can fire seconds before or after the content appears. | LCP. |
| DOMContentLoaded | It can fire before anything is on the screen. | FCP and LCP. |
| First Meaningful Paint | Its time jumped around from one load to the next, and only Chrome could measure it. Lighthouse dropped it. | LCP. |
| Time to Interactive | One small, late task can move it by seconds. Lighthouse 10 removed it. | TBT in the lab, INP in the field. |
| First Input Delay | It only timed the wait before the first interaction's code could start. INP replaced it in March 2024. | INP. |
| The Lighthouse score on its own | It blends five metrics from one lab load into one number, so it can't say what's wrong. | The metrics themselves, and field data. |
| An average load time | A few very slow loads pull it up, and it hides how many people had a bad time. | The 75th percentile. |
The Lighthouse score needs a closer look, because people quote it most of all. Lighthouse turns five lab metrics into scores from 0 to 100. Then it blends them into one number. Each metric gets a weight: its share of the total.
const weights = { FCP: 0.10, SI: 0.10, LCP: 0.25, TBT: 0.30, CLS: 0.25 }; function performanceScore(scores) { let total = 0; for (const [metric, weight] of Object.entries(weights)) total += scores[metric] * weight; return Math.round(total);} const slowToLoad = { FCP: 40, SI: 50, LCP: 30, TBT: 100, CLS: 100 };const slowToRespond = { FCP: 100, SI: 100, LCP: 100, TBT: 30, CLS: 50 }; console.log("slow to load:", performanceScore(slowToLoad));console.log("slow to respond:", performanceScore(slowToRespond));- Line 1 holds the weights Lighthouse has used since version 10. TBT counts most, at 30%.
SIis Speed Index. - Lines 3 to 7 are a function. Line 5 multiplies each metric's score by its weight and adds it to the total. Line 6 rounds it.
- Lines 9 and 10 are two made-up pages. The first is slow to load. The second loads fast but is slow to respond.
- It prints
slow to load: 72andslow to respond: 67.
Two close scores, and two different problems. A score near 70 doesn't say which problem you have. It's like the single grade on a school report from lesson 2.3. Lighthouse's own docs add three warnings:
- The score changes from run to run, with things like ads, network routes and the device you test on.
- The weights have changed over time.
- It can be more useful to think of performance as a spread of results than as one number.
Why it matters: when someone asks how fast the site is, answer with the metrics, from real visits where you can. Lesson 8.2, The Lighthouse score, shows how each metric becomes a score.
Which metric would you check?
Each problem below points at a different gauge. Sort each one by the metric you'd look at first:
- LCP got slower, and the page's HTML itself arrives late
- Pages are slow only when the server's database is busy
- The screen stays white while the stylesheet downloads
- Text appears late because a script in the head must run first
- In Lighthouse, heavy start-up JavaScript keeps the page busy after the first paint
- You can't measure INP in an automated lab test, but want a warning when scripts get heavier
- How long your search box takes to show results
- When the price is on the screen, the moment your shop cares about
Sort each problem by the metric you'd look at first.
Common mix-ups
- "LCP got slower, so the picture must be too big." Not always. On the slow morning, the picture was the same. The first byte came 1,500 ms later, and everything moved with it.
- "TTFB is just the server's time." No. It also includes redirects, looking up the server, connecting and TLS. A fast server far away can still have a slow TTFB.
- "A good TBT means a good INP." Not always. The slow store's TBT was good, but its Add to cart click needed improvement. TBT only covers the load.
- "TBT is all the time spent in long tasks." No. It counts only the part of each long task over 50 ms, and only between FCP and TTI.
- "The supporting metrics have to pass too." No. They're for finding causes. web.dev says a page doesn't have to meet the good TTFB limit, as long as its Core Web Vitals do well.
- "A Lighthouse score of 90 means the site is fast for everyone." No. It's one lab load, blended into one number.
- "Custom metrics need a library." No.
performance.mark()andperformance.measure()are built into every major browser.
Practice exercises
Answer first, then use the hints.
The server now takes 1.5 seconds to answer. What does the last line print?
const phases = {
  redirect: 0,
  dnsLookup: 60,
  connection: 150,
  tls: 150,
  waitingForServer: 1500,
};

const ttfb = Object.values(phases).reduce((total, ms) => total + ms, 0);
console.log("TTFB:", ttfb, "ms");
console.log(ttfb <= 800 ? "good" : ttfb <= 1800 ? "needs improvement" : "poor");poor. TTFB is now 1,860 ms, over the 1,800 ms poor limit. The server's wait is most of it.
FCP is at 1,000 ms here, and TTI at 2,000 ms. What does this print?
function totalBlockingTime(tasks, fcp, tti) {
  let total = 0;
  for (const task of tasks) {
    const start = Math.max(task.start, fcp);
    const end = Math.min(task.start + task.duration, tti);
    const length = end - start;
    if (length >= 50) total += length - 50;
  }
  return total;
}

const tasks = [
  { start: 700, duration: 400 },
  { start: 1600, duration: 90 },
];
console.log("TBT:", totalBlockingTime(tasks, 1000, 2000), "ms");TBT: 90 ms. Most of the first task ran before FCP, so only its last 100 ms count. They block 50 ms. The second task, 90 ms long, blocks 40.
Every metric scores 90, except TBT, which scores 0. What does this print?
const weights = { FCP: 0.10, SI: 0.10, LCP: 0.25, TBT: 0.30, CLS: 0.25 };

function performanceScore(scores) {
  let total = 0;
  for (const [metric, weight] of Object.entries(weights)) total += scores[metric] * weight;
  return Math.round(total);
}

const page = { FCP: 90, SI: 90, LCP: 90, TBT: 0, CLS: 90 };
console.log(performanceScore(page));63. Four metrics at 90 give 63 points. TBT's 30% gives none. One heavy script can cost almost a third of the score.
A page's HTML now arrives 900 ms later than before. Nothing else changes. About how much later will its FCP be?
About 900 ms. On the slow morning, FCP and LCP moved by about as much as the HTML did. A faster server moves them back by the same amount.
A trace is a recording of everything the browser did during a load. Download the slow morning's trace and open it in DevTools' Performance panel. Is most of the HTML request's bar the light part or the dark part?
The light part: waiting for the server's answer, about 1.5 seconds. The download, the dark part, is tiny.
Download the slow store's trace. Of its two long tasks, which one doesn't count toward TBT?
The first one: the start-up task, which runs buildIndex and showTeas. It ended just before FCP, so TBT doesn't count it. That's why the store's TBT is lower than lesson 1.4's blocking count.
Check your understanding
For each question, ask two things. Which step of the load does this metric time? Which Core Web Vital does it help explain?
Question 1 of 8Ravi's LCP is almost a second slower than usual. What can LCP alone tell him?
Choose an answer to see the explanation.
Question 2 of 8What does the second line of the blocking-time example print?
Read the code, then predict// A task's blocking time is the part over 50 ms. function blockingTime(taskMs) { return Math.max(0, taskMs - 50); } console.log(`A 147 ms task blocks for ${blockingTime(147)} ms.`); console.log(`A 40 ms task blocks for ${blockingTime(40)} ms.`);Choose an answer to see the explanation.
Question 3 of 8What does TTFB include?
Choose an answer to see the explanation.
Question 4 of 8On the recorded slow morning, the HTML arrived later than usual. What happened to FCP and LCP?
Choose an answer to see the explanation.
Question 5 of 8What does the TBT example print?
Read the code, then predictfunction totalBlockingTime(tasks, fcp, tti) { let total = 0; for (const task of tasks) { const start = Math.max(task.start, fcp); const end = Math.min(task.start + task.duration, tti); const length = end - start; if (length >= 50) total += length - 50; } return total; } const tasks = [ { start: 900, duration: 120 }, { start: 1500, duration: 60 }, { start: 2200, duration: 300 }, ]; console.log("TBT:", totalBlockingTime(tasks, 1000, 2400), "ms");Choose an answer to see the explanation.
Question 6 of 8The recorded slow store had a good TBT, but its Add to cart click needed improvement. How can both be true?
Choose an answer to see the explanation.
Question 7 of 8What does the last line of the score example print?
Read the code, then predictconst weights = { FCP: 0.10, SI: 0.10, LCP: 0.25, TBT: 0.30, CLS: 0.25 }; function performanceScore(scores) { let total = 0; for (const [metric, weight] of Object.entries(weights)) total += scores[metric] * weight; return Math.round(total); } const slowToLoad = { FCP: 40, SI: 50, LCP: 30, TBT: 100, CLS: 100 }; const slowToRespond = { FCP: 100, SI: 100, LCP: 100, TBT: 30, CLS: 50 }; console.log("slow to load:", performanceScore(slowToLoad)); console.log("slow to respond:", performanceScore(slowToRespond));Choose an answer to see the explanation.
Question 8 of 8Why stop quoting an average load time?
Choose an answer to see the explanation.
Key takeaways
- The Core Web Vitals say how a visit went. The supporting metrics say why. They aren't pass-or-fail on their own.
- TTFB is the wait for the first byte of the HTML. Good is 0.8 seconds or less. When it's late, everything after it is late too.
- FCP is when the first text or picture is drawn. Good is 1.8 seconds or less. LCP can't come before it.
- TBT adds up the part of each long task over 50 ms, between FCP and TTI. It stands in for INP in the lab, and can't see taps after the load.
- Speed Index is for comparing two versions of a page in the lab. Custom metrics, made with marks and measures, time what your product cares about.
- Stop quoting the load time, TTI, FID, averages, and the Lighthouse score on its own.
Remember the one-liner.
The vitals say how it went. TTFB, FCP and TBT say why. Your own marks time what matters to you.
Sources
The facts on this page come from these docs and source code:
- Time to First Byte (TTFB), web.dev.
- Network throttling, Lighthouse documentation.
- Performance features reference: network requests and timings, Chrome for Developers.
- First Contentful Paint (FCP), web.dev.
- Total Blocking Time (TBT), web.dev.
- Lighthouse Total Blocking Time, Chrome for Developers.
- TBTUtils.ts: how Lighthouse and DevTools add up blocking time, Chrome DevTools source.
- Speed Index, Lighthouse documentation.
- Custom metrics, web.dev.
- User Timing, MDN.
- First Meaningful Paint, Lighthouse documentation.
- What's new in Lighthouse 10, Chrome for Developers.
- Interaction to Next Paint becomes a Core Web Vital on March 12, web.dev.
- Lighthouse performance scoring, Chrome for Developers.
Coming next: Lab data vs field data, also in Why speed matters. It looks at why a lab test and your real visitors disagree, and how to use both.