What is web performance?
Learn what web performance means: how soon a page shows up, how fast it reacts, how smoothly it moves and how still it stays, measured on real devices.
- 01Name the four qualitiesTell loading, responding, smoothness and stability apart, and say which one a shopper's complaint is about.
- 02Measure them in your browserUse the browser's own stopwatch to read when a page showed up, how long a click took, whether a frame came late and whether something moved.
- 03Read a real page loadFollow the tea shop's recorded load, step by step, and say how much of the wait was the network and how much was the main thread.
- 04Test the way your users browseExplain why a fast laptop on fast Wi-Fi hides problems, and when you need a lab test and when you need real users' numbers.
Four ways a page can feel slow
Asha is on the bus, on her way home. She opens Leaf and Kettle, her favourite tea shop, on her cheap phone. She wants a bag of mint tea before her stop. The shop sells the best mint tea in town. Still, four different things can spoil her visit:
- The screen stays blank for a long time.
- She taps Add tea, and nothing happens for a moment.
- The list of teas stutters when she scrolls.
- A banner appears, the Buy button jumps down, and she taps the wrong thing.
To Asha, all four feel like "this site is slow". But they are four different problems, each with its own cause and fix.
Think of a café with wonderful tea, where you wait twenty minutes at the counter. The tea is still wonderful, but you might not stay to taste it. Web performance is about that side of a website. It isn't about what a page offers, but how it feels to use, on the visitor's own phone and network. Here are Asha's four problems as four small shop pages:
You sit down in a café. Your visit can go wrong in four ways, and none of them is about the tea. Your tea can take ages to arrive. You raise your hand, and the waiter doesn't look up. The waiter walks over in fits and starts. Someone bumps your table, and your cup slides away just as you reach for it. A good café gets all four right. So does a fast page.
- In real life: How soon your tea arrives
- In web performance: Loading: how soon the page and its main content show up
- In real life: How soon the waiter looks up when you raise your hand
- In web performance: Responding: how soon a tap shows its result
- In real life: The waiter walking over at an even pace
- In web performance: Smoothness: moving things, like a scrolling list, move evenly
- In real life: A table nobody bumps, so your cup stays put
- In web performance: Stability: things stay where they are while you read and tap
Each row of this table names one of the four, the question it asks, and how you'll measure it here:
| Quality | The question it answers | How this lesson measures it |
|---|---|---|
| Loading | How soon does the page show up, and how soon does its main content appear? | When the first text or image appeared, and when the largest one did. |
| Responding | After a tap, a click or a key press, how soon does the page show the result? | The time from the click until the next frame showed its result. |
| Smoothness | Do scrolling and animations move at an even speed? | The gaps between frames. A gap much longer than one frame is a stutter. |
| Stability | Do things stay where they are while the person reads and taps? | Whether things on screen moved when nobody asked them to, and how far. |
You can feel the second one, responding, right now. Here is a click that keeps the browser busy for 300 ms. A millisecond (ms) is a thousandth of a second, so 300 ms is almost a third of a second.
const add = document.querySelector("#add");const cart = document.querySelector("#cart");let count = 0; add.addEventListener("click", () => { const until = performance.now() + 300; while (performance.now() < until) { // Busy: the browser can't do anything else here, not even draw. } count = count + 1; cart.textContent = `Cart: ${count}`; console.log(cart.textContent);});- Lines 1 and 2 find the Add tea button and the cart's text on the page. Line 3 starts counting teas at 0.
- Line 5 asks the browser to run a function each time someone clicks Add tea. A function that runs when something happens is called an event handler.
- Line 6 reads the browser's stopwatch.
performance.now()gives the milliseconds since the page started loading. Adding 300 gives the time 300 ms from now. - Lines 7 to 9 loop until that time comes. The loop does nothing useful. It only keeps the browser busy, the way slow code does.
- Line 10 adds one tea. Line 11 puts the new count on the page. Line 12 prints it:
Cart: 1.
Press Edit & run and click Add tea. The cart does change, but only after the loop's 300 ms. While the loop runs, the browser can't draw anything, not even the change that line 11 asks for. That late reaction is one of Asha's four problems.
Web performance is how quickly and steadily a page does what people ask of it, on their own devices and networks. It has four parts: loading (the page shows up), responding (a tap shows its result), smoothness (moving things move evenly), and stability (things stay where they are).
Loading: how soon the page shows up
Back to the bus. Asha taps the link to the tea shop. When has the page "loaded"? When the first words appear? When the tea's picture shows? When she can tap Buy? Each is a different moment, and each one matters to her.
Think of a café visit as a string of moments. The door opens and someone says hello. A menu lands on your table, so you have something to read. Your cup of tea arrives. A little later, it's cool enough to drink. Ask "how long did it take?" and the answer depends on which moment you mean.
- In real life: The door opens and someone says hello
- In web performance: The first byte: the server starts sending the page
- In real life: A menu lands on your table
- In web performance: The first contentful paint: the first text or image is drawn
- In real life: Your cup of tea arrives
- In web performance: The largest contentful paint: the main content is drawn
- In real life: The tea is cool enough to drink
- In web performance: The page can react when you tap it
A page arrives in moments too. The browser notes the time of the first three:
- The first byte: the first piece of the page arrives from the server. A page starts as a text file called HTML, which describes what's on it. A byte is a tiny piece of data, about one letter of that text.
- The first contentful paint (FCP): the first text or image is drawn. To paint means to draw on the screen. Contentful means it has content, not only a background colour.
- The largest contentful paint (LCP): the largest text block or image in the part of the page you can see is drawn. That's usually the main content, such as a product photo or a headline.
The fourth moment, the tea cool enough to drink, is when the page can react to taps. That's the next section.
The browser keeps each of these times as an entry: a small record with a name and a time, in milliseconds from the moment the page started loading. You read entries with the Performance API: the built-in performance object from the first example. This code reads the first two moments:
const [page] = performance.getEntriesByType("navigation");const [firstPaint] = performance.getEntriesByName("first-contentful-paint"); console.log("first byte after", Math.round(page.responseStart), "ms");console.log("first text or image after", Math.round(firstPaint.startTime), "ms");- Line 1 asks for the entries of type
"navigation". Each page has one: a record of how it loaded, called its navigation entry. The square brackets aroundpagetake the first item from the list. - Line 2 asks for the entry named
"first-contentful-paint"in the same way. - Line 4 prints the entry's
responseStart: when the first byte arrived.Math.rounddrops the decimals. - Line 5 prints the paint entry's
startTime: when the first text or image was drawn.
The third moment needs one more step. The largest text or image can change while a page loads. A heading might be the largest thing at first, and then a big photo arrives. So the browser adds a new entry each time something larger is drawn, and the last one counts. To catch them, you use a PerformanceObserver: an object that calls your function whenever the browser adds new entries of a type you choose.
new PerformanceObserver((list) => { const entries = list.getEntries(); const largest = entries[entries.length - 1]; console.log("main content after", Math.round(largest.startTime), "ms"); console.log("it was", largest.element);}).observe({ type: "largest-contentful-paint", buffered: true });- Line 1 makes the observer. The function inside it gets a list of the new entries.
- Lines 2 and 3 take the last entry in the list: the largest element drawn so far.
- Line 4 prints when it was drawn. Line 5 prints the element itself.
- Line 6 starts watching for
"largest-contentful-paint"entries.buffered: truealso hands over the entries the browser added before this line ran.
Both blocks read the load of the page they run on, so they have no Edit & run. The panel below runs them on this lesson's own page:
const [page] = performance.getEntriesByType("navigation");
const [firstPaint] = performance.getEntriesByName("first-contentful-paint");

console.log("first byte after", Math.round(page.responseStart), "ms");
console.log("first text or image after", Math.round(firstPaint.startTime), "ms");

new PerformanceObserver((list) => {
  const entries = list.getEntries();
  const largest = entries[entries.length - 1];
  console.log("main content after", Math.round(largest.startTime), "ms");
  console.log("it was", largest.element);
}).observe({ type: "largest-contentful-paint", buffered: true });Reading…
Reading this page's load from your browser…
Here are the moments in a real load. The course built a small page for the tea shop and loaded it in Chrome 156, slowed down to behave more like a phone. Chrome saved a picture each time the screen changed:
- Nothing drawn yet
0 ms to 1,243 msA blank screen
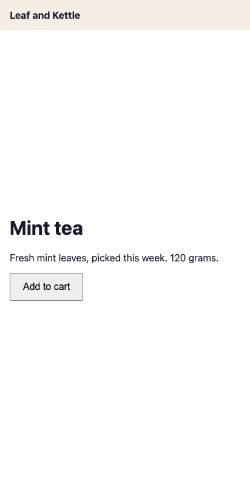
At 1,243 msThe text: the first contentful paint
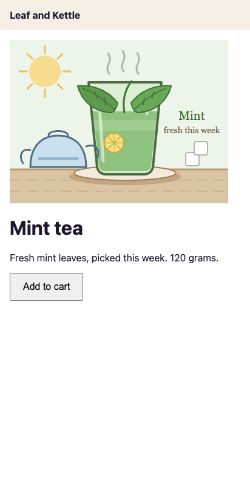
At 1,400 msThe picture: the largest contentful paint
The first words showed at 1,240 ms. That's the menu on the table. The picture of the tea, the largest element, showed at 1,396 ms. That's the cup arriving: the moment Asha sees what she came for.
Chrome uses the largest contentful paint as its main loading number. It's one of three Core Web Vitals: the numbers Google's tools use to judge how a page feels to use. A page counts as good when its main content shows within 2.5 seconds. Lesson 3.1, Core Web Vitals, covers all three. Lesson 5.1, The navigation timeline, takes one load apart, step by step.
Responding: how soon a tap shows its result
The page has loaded. Asha taps Add tea and waits to see her cart change. Responding is about that wait: the time from her tap until the screen shows the result.
A screen doesn't change bit by bit. It shows still pictures, one after another, like the pages of a flip book. Each picture is called a frame. The most common screens show 60 frames every second, and many show more. A tap's wait ends when a frame shows its result.
So why did the cart in the first example take 300 ms to change? Because of the main thread. A café counter shows what that is:
A small café has one person behind the counter. She takes the orders, makes the tea and hands it over, one job at a time. Now she starts grinding a big bag of spices. Your raised hand waits. The next order waits. Even a cup that's ready sits on the counter until she's done.
- In real life: The one person behind the counter
- In web performance: The main thread
- In real life: Grinding a big bag of spices
- In web performance: A slow click handler, like the 300 ms loop
- In real life: Taking the next order
- In web performance: Running the handler for the next click
- In real life: Handing over a cup that's ready
- In web performance: Drawing the next frame
A thread is one line of work that does one thing at a time. The browser runs a page's JavaScript on its main thread. The same thread also works out where everything goes on the page, and what to draw. web.dev's guide to long tasks puts it plainly: the main thread can only do one task, one piece of work, at a time. So while your click handler runs:
- the main thread can't draw the new cart text;
- it can't run the handler for the next click, so that tap waits its turn.
You don't have to guess how long a tap waited. The browser can time it, with its Event Timing API. For each slow event, it adds an entry saying how long it took from the tap until the next frame was drawn:
new PerformanceObserver((list) => { for (const entry of list.getEntries()) { if (entry.name === "click") { console.log("the click took", entry.duration, "ms to show its result"); } }}).observe({ type: "event", durationThreshold: 16 }); document.querySelector("#add").addEventListener("click", () => { const until = performance.now() + 200; while (performance.now() < until) {} document.querySelector("#cart").textContent = "Cart: 1";});Lines 1 to 7 are the stopwatch:
- Line 1 makes an observer, and line 7 starts it for entries of type
"event". - Lines 2 and 3 go through the new entries and keep the ones for clicks.
- Line 4 prints an entry's
duration: the time from the click until the next frame. - On line 7,
durationThreshold: 16asks for every event that took 16 ms or more, the lowest the browser allows. Without it, you only get events that took 104 ms or more.
Lines 9 to 13 are a slow click again. Lines 10 and 11 keep it busy for 200 ms, and line 12 changes the cart.
Press Edit & run and click Add tea. It prints a duration a little over 200 ms: the 200 ms loop, plus the time to draw the next frame. The browser rounds durations to the nearest 8 ms, for security reasons. Now try different busy times yourself:
new PerformanceObserver((list) => { for (const entry of list.getEntries()) { if (entry.name === "click" && entry.target === addButton) { showTime(entry.duration); } }}).observe({ type: "event", durationThreshold: 16 }); addButton.addEventListener("click", () => { busyFor(chosenDelay); addTeaToCart();});Cart: 0
- No clicks yet.
Pick how long the click keeps the main thread busy, then click Add tea. The busy time is 300 ms now.
Chrome's responsiveness number, Interaction to Next Paint (INP), is built from these entries. It looks at the taps, clicks and key presses during a whole visit, and reports one of the slowest. 200 ms or less counts as good. The stage Responsiveness: INP shows how to make slow handlers fast. The JavaScript lesson Keeping the main thread responsive shows how to split long work into pieces.
Smoothness: frames that arrive on time
Asha scrolls down the list of teas. For the list to glide, the screen needs a new frame on time, again and again, like a flip book whose pages turn at a steady speed. If one page sticks, the picture freezes, then jumps.
A screen that refreshes 60 times a second (60 Hz) needs a new frame every 16.7 ms: 1,000 ms divided by 60. At 120 Hz, a frame gets only 8.3 ms. That short time is the frame's budget.
Frames that need the main thread can't be drawn while it's busy: the person behind the counter again. If it's busy for longer than a frame's budget, the frames due in that time are skipped. The screen stands still, then jumps. That's a stutter.
You can catch a late frame from JavaScript, by timing the gaps between frames:
let last = performance.now();let longest = 0; function onFrame() { const now = performance.now(); longest = Math.max(longest, now - last); last = now; requestAnimationFrame(onFrame);}requestAnimationFrame(onFrame); setTimeout(() => { const until = performance.now() + 200; while (performance.now() < until) {}}, 300); setTimeout(() => { console.log(longest >= 200 ? "one frame waited 200 ms or more" : "every frame was on time");}, 1000);- Lines 1 and 2 keep the time of the last frame and the longest gap so far.
requestAnimationFrameasks the browser to run a function just before it draws the next frame. Line 10 asks for the first one.- Lines 4 to 9 are that function. Line 5 reads the time now. Line 6 keeps the gap since the last frame, if it's the longest so far. Line 7 remembers this frame's time. Line 8 asks again for the next frame, so the function runs on every frame.
- Lines 12 to 15 wait 300 ms, then keep the main thread busy for 200 ms, like the slow click.
- Lines 17 to 19 print the result after one second.
Press Edit & run. It prints one frame waited 200 ms or more. For those 200 ms, no frame could be drawn, so one gap was at least that long.
function onFrame() { const now = performance.now(); gaps.push(now - last); last = now; cup.style.transform = `translateX(${cupPosition(now)}px)`; requestAnimationFrame(onFrame);}requestAnimationFrame(onFrame);Moved by JavaScript, one frame at a time
Moved by a CSS animation
- Frames a second
- not running
- Longest gap
- not running
- Late frames
- not running
Press Start. Both cups slide back and forth at the same even speed.
Watch the CSS cup in the panel. It keeps gliding while the JavaScript cup jumps. Browsers can run some CSS animations without the main thread, like this one, which moves the cup with transform. None of the Core Web Vitals measures smoothness, but DevTools shows late frames in its Performance panel. The stage Stability and smoothness covers animations that stay smooth.
Stability: things stay where they are
Asha reaches for the Buy button. Just then, a banner about free delivery appears above it. The button jumps down, and her thumb lands on the wrong thing.
A page is stable when what you're reading, or about to tap, stays where it is: the café table that nobody bumps. A layout shift is when something on the screen moves because something else changed. web.dev lists the most common causes:
- pictures without a width and height;
- ads, banners and other content added late, with no space kept for it;
- web fonts, which can change how much space the text takes.
Here is the banner problem in code:
const buy = document.querySelector("#buy");const before = buy.getBoundingClientRect().top; const banner = document.createElement("p");banner.textContent = "Free delivery today";document.querySelector("#news").append(banner); const after = buy.getBoundingClientRect().top;console.log("the Buy button moved down:", after > before);- Line 1 finds the Buy button.
- Line 2 notes how far the button is from the top of the window.
getBoundingClientRect()gives an element's position and size on the screen. - Lines 4 and 5 make a paragraph with the banner's text.
- Line 6 puts it inside the empty
#newselement, which sits above the heading. - Line 8 measures the button again. Line 9 prints whether it moved down:
the Buy button moved down: true.
Chromium browsers, such as Chrome and Edge, can also score each shift. They do it with the Layout Instability API. The score is bigger when more of the screen moves, and when it moves farther. Try it with a banner that arrives 800 ms late:
let score = 0;new PerformanceObserver((list) => { for (const shift of list.getEntries()) { if (!shift.hadRecentInput) score = score + shift.value; } console.log("layout shift score so far:", score.toFixed(3));}).observe({ type: "layout-shift", buffered: true });Mint tea
Press Load the page. The banner arrives 800 ms later, the way a late ad or notice does.
In the panel's code:
- Line 1 starts the score at 0. Lines 2 to 7 make an observer for
"layout-shift"entries. - Line 4 adds each shift's
valueto the score. It skips shifts markedhadRecentInput: those within 500 ms of the person's own tap or key press. Those moves are expected, like a menu opening when you tap it. - Line 6 prints the total so far.
That's why the panel's banner waits 800 ms after you press the button. A move that late counts.
Chrome's stability number is Cumulative Layout Shift (CLS). It adds up the shift scores in the worst burst of shifts during a visit. 0.1 or less counts as good. To stop shifts, keep space for anything that arrives late, the way the panel's Keep space button does. The stage Stability and smoothness covers the rest.
Measured speed and felt speed
A number like "loaded in 2.4 seconds" doesn't tell you how the wait felt. Two pages can finish at the same moment and still feel very different. You know this from lifts:
Two lifts take exactly as long to reach you. Above the first one's door, a small screen counts down the floors: 7, 6, 5, 4. Above the second, there's only a blank wall. With the first, you can see it coming and guess when it'll arrive. With the second, the wait drags, and you start to wonder if it's stuck.
- In real life: Two lifts that arrive at the same moment
- In web performance: Two pages that finish loading at the same time
- In real life: The floor numbers counting down
- In web performance: Parts of the page showing as soon as they're ready
- In real life: The blank wall
- In web performance: A blank screen until everything is done
- In real life: The display doesn't make the lift any faster
- In web performance: Showing parts early doesn't make the data arrive sooner
Try it with two loaders that both take 2.4 seconds:
// Loader 1: nothing, then everything at 2,400 ms.
setTimeout(() => showEverything(blankLoader), 2400);

// Loader 2: each part as soon as it is ready.
showOutline(partsLoader);
setTimeout(() => showText(partsLoader), 800);
setTimeout(() => showPicture(partsLoader), 2400);1. Blank until done
2. Parts as they're ready
Press Start and watch both loaders. Which one feels faster?
The second loader showed its outline at once and its words at 800 ms. You could start reading 1.6 seconds earlier, though both finished together. How fast a page feels is called perceived performance. web.dev makes the same point: two sites can finish loading at the same time, yet one can seem faster, because it shows its content bit by bit. That's why loading is measured by when content appears (FCP and LCP), not by when the last file arrives.
In 1993, Jakob Nielsen summed up three limits for how a wait feels, and they're still used today. Each row is a length of wait, and how it feels:
| How long the wait is | How it feels |
|---|---|
| About 0.1 second | It feels instant. The person feels the page reacted to them directly. |
| About 1 second | The person notices the wait, but keeps their mind on what they were doing. |
| About 10 seconds | The most a person waits with their attention on the task. Past this, they start doing something else. |
For long waits, Nielsen advises showing progress, like the lift's floor numbers. Progress tells people nothing has crashed. It shows roughly how long is left. And it gives them something to look at.
Feeling fast doesn't replace being fast. The display doesn't bring the lift any sooner, and a spinner doesn't bring the data any sooner. Lesson 2.1, 0.1 seconds, 1 second, 10 seconds, and lesson 2.2, Perceived performance, go deeper.
The phones and networks your users have
You probably build on a fast laptop, on fast Wi-Fi. When you test, the site's files are often already saved from your last visit. Asha has none of that:
- Her phone is cheaper, with a slower CPU, the chip that runs the code.
- Her mobile network takes longer to answer.
- It's her first visit, so nothing is saved.
The same code runs at a different speed on every device. Time some work on yours:
function sortPrices() { const prices = Array.from({ length: 200000 }, (_, i) => (i * 7919) % 1000); return prices.sort((a, b) => a - b);} const start = performance.now();const sorted = sortPrices();const took = performance.now() - start; console.log("cheapest price:", sorted[0]);console.log("the work took some time:", took > 0);Not timed yet.
Press Time it. The panel sorts 200,000 prices 5 times on this device and keeps the middle time.
The code in the panel, line by line:
- Lines 1 to 4 are a function that makes 200,000 prices and sorts them from lowest to highest.
- Line 6 notes the time. Line 7 calls the function. Line 8 works out how long it took.
- Line 10 prints
cheapest price: 0. - Line 11 prints
the work took some time: true. The time itself changes with every run and every device, so the example only checks that some time passed. The panel shows the real times.
To see what Asha sees, tools slow your own computer down on purpose. This is called throttling:
- Lighthouse, a page test built into Chrome's developer tools, tests a phone with the CPU 4 times slower than the computer running it. It imitates a network with a 150 ms round trip and a download speed of 1.6 Mbps (megabits per second). Its screen is 412 by 823 pixels.
- DevTools, those developer tools themselves, can slow the CPU and the network too. Its Network panel has presets for the network. Each row is one preset:
| DevTools preset | Round trip it imitates | Download speed | Upload speed | Wait DevTools adds to each request |
|---|---|---|---|---|
| Fast 4G | 60 ms | 8.1 Mbps | 1.35 Mbps | 165 ms |
| Slow 4G | 150 ms | 1.44 Mbps | 0.675 Mbps | 562.5 ms |
| 3G | 400 ms | 0.4 Mbps | 0.4 Mbps | 2000 ms |
A round trip is the time for a message to reach the server and for an answer to come back. DevTools slows each whole request, not each piece of data, so it adds more wait than the round trip it imitates.
That gives you two ways to get numbers, and they answer different questions.
A café owner wants to know how long customers wait for their tea. One quiet morning, she orders a cup herself and times it with a stopwatch. She can repeat that test and watch every step. But it's one visit, on a quiet morning. So she also has the till note every customer's wait, all week, through the lunch rush she never saw.
- In real life: The owner timing her own order with a stopwatch
- In web performance: A lab test: one load, on a device and network you choose
- In real life: Watching every step of that one visit
- In web performance: Seeing why one load was slow: every request and every task
- In real life: The till's note of every customer's wait
- In web performance: Field data: timings from real people's visits
- In real life: The lunch rush she never saw
- In web performance: The slow phones and busy networks you didn't test
A lab test runs on one device you control, like your laptop with DevTools slowing it down. Field data comes from real people's visits, on their own phones and networks. Each row asks the same question of both:
| Question | A lab test | Real users (field data) |
|---|---|---|
| Where does it run? | On one device you choose, such as your laptop with DevTools slowing it down, or a test server. | On every visitor's own phone or computer, on their own network. |
| What does it tell you? | Why one load was slow: every request, every task and every frame, in detail. | How fast the site really is for people, across many visits. |
| Can you repeat it? | Yes. The same page, device and network give similar numbers each time. | No. Each visit is different, so you read the spread of many visits. |
| What is it good for? | Finding the cause of a problem and checking a fix before you ship it. | Finding which pages and users have a problem, and checking that a fix helped them. |
You need both: the lab to find out why a load was slow, and the field to find out who it's slow for. Lesson 1.3, The performance inequality gap, looks at the phones and networks people really have. Lesson 3.3, Lab data vs field data, compares the two in depth.
Where the time goes on a page load
Back to the tea shop's page from the filmstrip. Its main content took 1,396 ms to show. Where did that time go? Here is the whole page: three files, plus one picture, hero.svg. They load from a server, so they have no Edit & run. You can open the page itself instead.
<!doctype html><html lang="en"><head> <meta charset="utf-8"> <meta name="viewport" content="width=device-width, initial-scale=1"> <title>Leaf and Kettle</title> <link rel="stylesheet" href="styles.css"> <script src="app.js" defer></script></head><body> <header>Leaf and Kettle</header> <main> <img id="hero" src="hero.svg" alt="A glass of mint tea" width="360" height="270"> <h1>Mint tea</h1> <p>Fresh mint leaves, picked this week. 120 grams.</p> <button id="add">Add to cart</button> </main></body></html>- Line 7 loads the styles. The browser waits for them before it draws the page, so the text never shows without its styles.
- Line 8 loads
app.jswithdefer. The browser downloads it while it reads the HTML, and runs it once the whole HTML has been read. - Line 13 is the picture, with its width and height, so the browser keeps its space before it arrives.
body { margin: 0; font-family: system-ui, sans-serif; color: #1d1830; }
header { padding: 16px; font-weight: 700; background: #f4efe4; }
main { padding: 16px; }
#hero { display: block; max-width: 100%; height: auto; }
button { padding: 12px 20px; font-size: 16px; }
Line 4 lets the picture shrink on a narrow screen. height: auto keeps its shape, from the width and height on line 13 of the HTML.
// Work the page does as it starts: sort 200,000 prices.const prices = Array.from({ length: 200000 }, (_, i) => (i * 7919) % 1000);prices.sort((a, b) => a - b); document.querySelector("#add").addEventListener("click", () => { document.querySelector("#add").textContent = "Added";});Lines 2 and 3 do work as the page starts: they sort 200,000 prices, like the device panel. Lines 5 to 7 make the Add to cart button say Added when it's clicked. So the button only works once app.js has run.
The course loaded this page in Chrome 156, on a phone-sized screen like Lighthouse's. The network was DevTools' Slow 4G, and the CPU ran 4 times slower. Of 5 loads, the picture showed at 1,380 ms, 1,384 ms, 1,396 ms, 1,396 ms and 1,464 ms. The numbers below come from the middle load.
app.js running on the main thread. The two lines mark when the text and the picture showed.Each row is one step of the load, in the order the steps started. Times are milliseconds after the page started loading:
| What happened | Who did the work | When |
|---|---|---|
| Download the HTML page | The network | 0 ms to 582 ms |
| Download styles.css | The network | 609 ms to 1,190 ms |
| Download app.js | The network | 610 ms to 1,207 ms |
| Download hero.svg, the picture | The network | 610 ms to 1,223 ms |
| Show the header and the text: the first contentful paint | The screen | at 1,240 ms |
| Run app.js: sort 200,000 prices | The main thread | 1,245 ms to 1,388 ms |
| Show the picture: the largest contentful paint | The screen | at 1,396 ms |
Read the picture from left to right. The load happened in three stretches:
- The HTML. It took 582 ms to arrive, though it's only 846 bytes. On Slow 4G, DevTools holds every request back by 562.5 ms before any data flows. So almost all of that time was waiting, not downloading.
- The three files. As soon as the HTML arrived, the browser found the three files it names and asked for all three at once. They arrived side by side, between 1,190 ms and 1,223 ms, each after the same wait.
- The main thread. The text showed at 1,240 ms, just after
styles.cssarrived. The picture had arrived at 1,223 ms, but it didn't show until 1,396 ms. At 1,245 ms, the main thread started runningapp.js, and it stayed busy for 143 ms. Drawing the picture had to wait, like a cup that sits ready while the person behind the counter grinds spices.
When the main thread is busy for longer than 50 ms in a row, that stretch is called a long task. This one lasted 143 ms. The Add to cart button had to wait for it too. Its click handler comes from app.js, so it only worked once app.js had finished, at 1,388 ms. Until then, the tea was too hot to drink. A page can look ready before it can respond.
So how much of the wait was the network? A little arithmetic answers it:
// The tea shop's middle load. Times are in ms after it started.const load = { lastFileArrived: 1223, pictureShown: 1396 }; const share = Math.round((load.lastFileArrived / load.pictureShown) * 100);console.log(`${share}% of the wait for the picture was spent fetching files.`);- Line 1 says where the numbers come from.
- Line 2 holds two recorded times: the last file arrived at 1,223 ms, and the picture showed at 1,396 ms.
- Line 4 divides one by the other and turns the result into a whole percentage.
- Line 5 prints
88% of the wait for the picture was spent fetching files.
On this page, the network cost the most, so a fix there would help most. On another page, the main thread can cost more. Every load spends its time on the same three things: the network, the main thread, and drawing the screen. Measure to find out which costs most.
You can check all of this yourself. Open the tea shop page and record it in DevTools' Performance panel. Or download the trace behind the numbers above: a file of everything Chrome did during that load, which the Performance panel can open. Exercise 6 uses it.
A map of this course
The rest of the course goes deeper into each quality, from the first byte to the last frame. Each row is one stage, what it teaches, and how many lessons it has:
| Stage | What it teaches | Lessons |
|---|---|---|
| 1. Why speed matters | What web performance is, why users and businesses care, how people perceive speed, and the metrics that measure it. | 11 |
| 2. How the browser loads and renders | The network, the journey from URL to first pixels, and the rendering pipeline: the mechanics every optimization depends on. | 16 |
| 3. Measuring in the lab | Chrome DevTools, Lighthouse, WebPageTest, and other lab tools: record, read, and compare results you can trust. | 17 |
| 4. Measuring real users | Chrome's field data, the browser's performance APIs, real user monitoring, and the statistics to read it all. | 18 |
| 5. Fast servers, caches, and networks | Time to first byte, caching at every layer, CDNs, compression, and resource hints. | 12 |
| 6. Loading content fast: LCP | Largest Contentful Paint in depth, then images, video, fonts, and CSS: the content users wait for. | 17 |
| 7. JavaScript loading | Ship less JavaScript, load it in the right order, tame third parties, and use service workers for speed. | 13 |
| 8. Responsiveness: INP | Interaction to Next Paint in depth, the main thread, fast event handlers, and memory. | 16 |
| 9. Stability and smoothness | Cumulative Layout Shift in depth, rendering performance, and animation that stays smooth. | 13 |
| 10. Instant navigations | The back/forward cache, prefetching and prerendering, and fast navigations in single-page apps. | 5 |
| 11. Architecture and frameworks | How rendering strategies shape every metric, and performance in React, Next.js, Angular, Vue, Svelte, Astro, and Qwik. | 10 |
| 12. Devices, networks, and people | Low-end phones, slow networks, adaptive loading, webviews, accessibility, and the energy cost of the web. | 6 |
| 13. Performance as a practice | Budgets, continuous integration, monitoring, audits, experiments, the business case, and a performance culture. | 11 |
| 14. Under the hood | How browsers load, render, and measure pages, network internals, and how new performance standards are made. | 9 |
| 15. Projects | Guided projects on real code, and a capstone audit of a site you choose. | 7 |
Where each quality is covered:
- Loading: Fast servers, caches, and networks, Loading content fast: LCP and JavaScript loading.
- Responding: Responsiveness: INP.
- Smoothness and stability: Stability and smoothness.
- Measuring all four, in the lab and with real users: Measuring in the lab and Measuring real users.
The course builds on the JavaScript path's performance lessons, such as Measuring performance and Keeping the main thread responsive. It links to them instead of repeating them.
Sort real complaints
People don't name the quality when they complain. They say what happened to them, the way Asha would. Sort each complaint: is it about loading, responding, smoothness or stability?
- "I stared at a white screen for five seconds."
- "I pressed Pay and nothing happened for a whole second."
- "I went to tap Cancel, an ad appeared above it, and I tapped Buy instead."
- "The product list stutters when I scroll."
- "The text showed up quickly, but the product photo took ages."
- "Letters appear a moment after I type them in the search box."
- "The text jumped when the fancy font loaded."
- "The loading spinner froze and then jumped ahead."
Sort each complaint into loading, responding, smoothness or stability.
Common mix-ups
- "A fast page is a small page." No. Size is only one cause. The tea shop's HTML is 846 bytes, yet its main content took 1,396 ms on Slow 4G. Most of that was waiting, not downloading.
- "If it's fast on my laptop, it's fast." No. Your laptop, network and saved files can be much faster than your users'. Test with the network and the CPU slowed down, and check real users' numbers.
- "Performance means loading." No. A page that loads quickly can still react late, stutter or jump. There are four qualities.
- "The page is ready when the load event fires." No. The
loadevent fires when the page's files have arrived. People care about when they see the content and can use it. That can be earlier or later. - "A spinner makes a page faster." No. Like the lift's display, it can make a wait feel shorter, but the data arrives no sooner. Showing real content early is what helps.
- "One measurement tells you the speed." No. Every load is a little different. The tea shop's 5 loads, on the same computer, showed their main content between 1,380 ms and 1,464 ms. Real visits vary more, because their devices and networks differ. So you look at many measurements.
Practice exercises
Answer first, then use the hints.
A shopper writes: "I pressed Pay and nothing happened for a whole second." Which of the four qualities is this about?
Responding. The page had loaded, and nothing moved. The problem is the time from the tap until the page showed a result. A whole second is far over the 200 ms that Interaction to Next Paint calls good. The usual cause is a click handler, or other work, keeping the main thread busy.
In the recorded tea shop load, the picture had finished downloading before it showed on screen. How many milliseconds passed in between?
173 ms. The picture finished downloading at 1223 ms and showed at 1396 ms. For 143 ms of that gap, the main thread was busy running app.js, so it couldn't draw the picture.
This is the banner example, with one change on line 6. What does it print?
const buy = document.querySelector("#buy");
const before = buy.getBoundingClientRect().top;

const banner = document.createElement("p");
banner.textContent = "Free delivery today";
buy.after(banner);

const after = buy.getBoundingClientRect().top;
console.log("the Buy button moved down:", after > before);It prints the Buy button moved down: false. Line 6 adds the banner after the button, so nothing above the button changes, and the button stays where it was. Only things below the banner move. That's why late content is safest at the end of the page, or in space kept for it.
Every click on Add tea waits before the cart changes. Which lines keep each click waiting, and how would you fix it?
const add = document.querySelector("#add");
const cart = document.querySelector("#cart");
let count = 0;

add.addEventListener("click", () => {
  const prices = Array.from({ length: 200000 }, (_, i) => (i * 7919) % 1000 + 250);
  prices.sort((a, b) => a - b);
  count = count + 1;
  cart.textContent = `Cart: ${count}, cheapest tea ${prices[0]} cents`;
  console.log(cart.textContent);
});const add = document.querySelector("#add");
const cart = document.querySelector("#cart");
let count = 0;
const prices = Array.from({ length: 200000 }, (_, i) => (i * 7919) % 1000 + 250);
prices.sort((a, b) => a - b);
add.addEventListener("click", () => {
count = count + 1;
cart.textContent = `Cart: ${count}, cheapest tea ${prices[0]} cents`;
console.log(cart.textContent);
});Lines 6 and 7. Every click makes and sorts 200,000 prices before the cart can change, and the result never changes. In the fix, lines 5 and 6 sort them once, when the page starts. Each click then only adds one and updates the text. On a phone with a slow CPU, the old click could take long enough to be a long task.
On this page, the heading and the Buy button jump down when the picture loads. Which two attributes does the <img> need, so they stay still? The picture isn't available inside the editor, so this exercise has no Edit & run.
<header>Leaf and Kettle</header>
<img src="hero.svg" alt="A glass of mint tea">
<h1>Mint tea</h1>
<button id="buy">Buy</button><header>Leaf and Kettle</header>
<img src="hero.svg" alt="A glass of mint tea" width="360" height="270">
<h1>Mint tea</h1>
<button id="buy">Buy</button>width and height. With them, the browser works out the picture's shape before it arrives and keeps its space. So the heading and the Buy button don't move when it loads. With height: auto in the CSS, it still shrinks on a narrow screen and keeps its shape. In the tea shop filmstrip, the picture's space was already there in the first frame.
Open the tea shop page in Chrome and open DevTools. In the Performance panel, set the CPU to 4 times slower and the network to Slow 4G, then record a reload. Or download the recorded trace and load it into the Performance panel. Which element does DevTools name as the LCP element?
The picture: img#hero. It's the largest element in the visible part of the page, so it's what LCP measures. In the recorded trace, it showed at 1396 ms. In your own recording, the time depends on your device and your settings, but the element is the same.
Check your understanding
For each question, ask two things. Which of the four qualities is it about? And what was busy: the network, or the main thread?
Question 1 of 7A page shows its text quickly, but its Buy button jumps down when a banner appears above it. Which quality is the problem?
Choose an answer to see the explanation.
Question 2 of 7A click handler keeps the main thread busy for 300 ms. What can the browser do with that tab in the meantime?
Choose an answer to see the explanation.
Question 3 of 7What does this frame-gap example print, in a tab you're looking at?
Read the code, then predictlet last = performance.now(); let longest = 0; function onFrame() { const now = performance.now(); longest = Math.max(longest, now - last); last = now; requestAnimationFrame(onFrame); } requestAnimationFrame(onFrame); setTimeout(() => { const until = performance.now() + 200; while (performance.now() < until) {} }, 300); setTimeout(() => { console.log(longest >= 200 ? "one frame waited 200 ms or more" : "every frame was on time"); }, 1000);Choose an answer to see the explanation.
Question 4 of 7Two loaders both finish at 2.4 seconds. One stays blank until the end. The other shows the outline at once and the text at 0.8 seconds. Which one do most people feel is faster?
Choose an answer to see the explanation.
Question 5 of 7In the recorded tea shop load,
hero.svgfinished downloading beforeapp.jsstarted running. But the picture only showed afterapp.jsfinished. Why?Choose an answer to see the explanation.
Question 6 of 7A click handler takes 60 ms on your laptop. Lighthouse's phone test slows the CPU 4 times. About how long would it take there?
Choose an answer to see the explanation.
Question 7 of 7Why test with DevTools' Slow 4G network and a slowed-down CPU, when your own laptop is fast?
Choose an answer to see the explanation.
Key takeaways
- Web performance has four qualities: loading (the page shows up), responding (a tap shows its result), smoothness (moving things move evenly), and stability (things stay where they are).
- Loading happens in moments: the first byte, the first contentful paint, and the largest contentful paint, which is usually the main content. The browser reports each one.
- The main thread runs your JavaScript and works out what to draw, one job at a time. While it's busy, taps wait and frames are skipped. At 60 Hz, a frame is due every 16.7 ms.
- A layout shift is content moving when nobody asked it to. Keeping space for late content stops it.
- How fast a page feels depends on when useful content appears, not only on when everything is done.
- Test the way your users browse: in the lab with the network and the CPU slowed down, and with real users' numbers from the field.
- Every load spends its time on the network, the main thread and drawing. Measure to find out which costs most.
Remember the one-liner.
A fast page shows up soon, reacts soon, moves evenly and stays still, on your users' devices, not just yours.
Sources
The facts on this page come from these specifications and docs:
- User-centric performance metrics, web.dev.
- Web Vitals, web.dev.
- Navigation Timing Level 2, W3C.
- Paint Timing, W3C.
- Largest Contentful Paint, W3C.
- Event Timing, W3C.
- Optimize long tasks, web.dev.
- Window: requestAnimationFrame() method, MDN.
- Layout Instability, WICG.
- Optimize Cumulative Layout Shift, web.dev.
- Performance APIs, MDN.
- How to create high-performance CSS animations, web.dev.
- Response Times: The 3 Important Limits, Jakob Nielsen, Nielsen Norman Group.
- Network throttling, the Lighthouse docs.
- constants.js: Lighthouse's default settings, including its phone screen, Lighthouse source code.
- NetworkManager.ts, where DevTools defines its network presets, Chrome DevTools source code.
- What's new in DevTools, Chrome 134 (calibrated CPU throttling), Chrome for Developers.
Coming next: Why performance matters. It looks at what speed changes for the people using a site, and which famous numbers about it are well sourced.