Your toolkit and the course project
Set up Chrome, Firefox and Safari and DevTools for measuring, run the course's slow tea store, take a first baseline, and keep a performance log.
- 01Pick the tool for the questionSay what the Performance panel, Lighthouse, WebPageTest, CrUX and web-vitals each answer, and which ones are lab tools.
- 02Set up your browsers and DevToolsCheck what Chrome, Firefox and Safari can measure, and set DevTools up the same way every time.
- 03Run the course's slow storeOpen it on the site or serve it from your computer, and name its problem for loading, responding and stability.
- 04Take a baseline and log itLoad a page 5 times with fixed settings, keep the middle run, and write it down so later fixes can be compared.
A toolkit, a store and a log
Ravi looks after the Leaf and Kettle website. In lesson 1.3, he saw Asha wait nearly eight seconds for the tea list on her phone, while his laptop showed it in about half a second. Now he has an idea for a fix. He changes the code, reloads the page on his laptop, and it feels quick.
So, did his change work?
He can't tell yet. "It feels quick" isn't a number, and his laptop isn't Asha's phone. Watch what happens if he measures the page one way before his change, and another way after it. These are two real loads from lesson 1.3. Nobody touched the page between them:
// Two loads of the same page from lesson 1.3. Nothing in it changed.const before = { lcp: 7628, setting: "a low-end phone on 3G" };const after = { lcp: 564, setting: "a fast laptop" }; const saved = before.lcp - after.lcp;console.log(`"My change saved ${saved} ms!"`);console.log(`Measured the same way? ${before.setting === after.setting}`);- Line 1 is a comment. The numbers are LCP times in milliseconds (ms). A millisecond is a thousandth of a second. LCP, from lesson 1.1, is the moment the largest text or picture appears on the screen.
- Line 2 is the "before": the page loaded on a laptop slowed down to act like a low-end phone on 3G. Its LCP was 7,628 ms.
- Line 3 is the "after": the same page, loaded on a fast laptop. Its LCP was 564 ms.
- Line 5 subtracts one from the other. Line 6 prints
"My change saved 7064 ms!". - Line 7 compares the two settings and prints
Measured the same way? false.
Seven seconds "saved", and the page didn't change at all. The whole difference came from how it was measured. That's the trap. A number only means something next to another number measured the same way.
So before Ravi changes a single line, he needs three things:
- tools that measure, each one answering the question he has;
- a practice page he can break and fix as often as he likes;
- a habit: measure the same way every time, before and after each change, and write it down.
This lesson sets up all three. You'll use them for the rest of the course. Here is the habit in one picture:
A baker wants a better cake. First she bakes the usual recipe and writes down how it turned out. Then she changes one thing, say less sugar, bakes again in the same oven, and writes that down too. If she changed the sugar and the oven at once, she could never tell which one made the difference.
- In real life: The first cake, before any change
- In web performance: The baseline: the page's numbers before you change anything
- In real life: The same oven, at the same heat
- In web performance: The same browser and settings for every measurement
- In real life: One change per cake
- In web performance: One change between two measurements
- In real life: The notebook with every cake in it
- In web performance: The performance log
Measure the same way every time: the same browser, the same settings, the same number of runs. A baseline is a page's numbers before you change anything. A performance log is a file where you write the baseline, then each change and its numbers. With both, you can tell what every change did.
One tool for each question
Read about web performance, and you'll meet a crowd of tool names: DevTools, Lighthouse, WebPageTest, CrUX, PageSpeed Insights, web-vitals. It can feel as if you must learn them all at once. You don't. Each one answers a different question. You pick the tool that fits the question you have.
A mechanic doesn't fix every car with one tool. She holds a stethoscope to the engine to hear what's inside, works through an inspection checklist, and takes the car for a test drive. To learn how it does day to day, she reads the owners' reports, and the trip log some cars keep of every drive.
- In real life: The stethoscope on the running engine
- In web performance: DevTools' Performance panel: what the browser did, moment by moment
- In real life: The inspection checklist
- In web performance: Lighthouse: a standard test, with a score and a list of fixes
- In real life: The test drive on a real road
- In web performance: WebPageTest: a real browser loads your page on a computer somewhere else
- In real life: The owners' reports
- In web performance: CrUX: how real Chrome users' visits went
- In real life: The trip log a car keeps of every drive
- In web performance: web-vitals: a script on your page that measures each visit
The tools fall into two groups. You met both in lesson 1.1, as the café owner's stopwatch and her till:
- Lab tools are the stopwatch. You run a test on one computer, with settings you choose. You can repeat it and watch every step.
- Field data is the till. It comes from real people's visits, on their own phones and networks.
Each row of this table is one tool, the question it answers, and which group it belongs to:
| Tool | The question it answers | Lab or field? |
|---|---|---|
| DevTools' Performance panel | What exactly did the browser do during this load or click, and when? | Lab: a test on your own computer. |
| Lighthouse | How does the page do in a standard test, and what should I fix first? | Lab: a test on your own computer, or in PageSpeed Insights. |
| WebPageTest | How does the page load in a real browser, on a test computer somewhere else? | Lab: a test on one of WebPageTest's computers. |
| CrUX, shown in PageSpeed Insights | How fast was the site for real Chrome users? | Field: real visits, gathered by Chrome. |
| The web-vitals library | How fast was each visit to my own pages? | Field: real visits, measured by a script on your page. |
Here they are one at a time, each with the lesson that teaches it in depth.
DevTools and its Performance panel
Chrome comes with a set of tools for web developers, built into the browser. They're called DevTools. To open them, right-click anything on a page and choose Inspect. One of their panels is the Performance panel. It records what the browser did while a page loaded, or while you clicked: the files it fetched, the scripts it ran, and what it painted.
When you open it, it also shows the page's three Core Web Vitals from lesson 1.1 live: LCP, CLS and INP. This lesson uses it more than any other tool. Lesson 7.1, The Performance panel, gives the full tour.
Lighthouse
Lighthouse is an open-source test from the Chrome team, with its own panel in DevTools. You give it a page, and it tests it the way lesson 1.1 described: as a phone, with the CPU 4 times slower and a slow network. Then it runs a list of checks, called audits, and writes a report with a score. Each failed audit explains why it matters and how to fix it. Lesson 8.1, How Lighthouse works, shows what happens during a run.
WebPageTest
WebPageTest, at webpagetest.org, runs the test on a computer somewhere else. It loads your page in a real browser, on a test computer in a place you pick from its list, over a connection speed you pick. It records a video of the load. That answers a question your own computer can't: how does the page load for someone far from where you sit? Lesson 9.1, WebPageTest basics, covers it.
CrUX and PageSpeed Insights
Lesson 1.2 met the Chrome UX Report (CrUX): Google's public record of how real Chrome users' visits went, on sites with enough visitors. It's field data. It answers "How fast is my site for the people who really visit it?"
The easiest way to see it is PageSpeed Insights, a web page from Google. Type in an address, and it shows the CrUX numbers for that page or site, next to a Lighthouse test of it. Lesson 10.1, The Chrome User Experience Report, covers CrUX. Lesson 10.2, PageSpeed Insights and Search Console, covers the page.
The web-vitals library
CrUX only counts Chrome users, and only those whose browser settings allow it. To measure every visit yourself, you add a small script to your own pages. web-vitals is a tiny JavaScript library from the Chrome team that does this. In each visitor's browser, it measures LCP, INP and CLS the way Chrome does. Your page then sends the numbers to a server you choose. Lesson 12.1, The web-vitals library, sets it up.
For now, you only need DevTools. The other tools get their own lessons. Why it matters now: a Lighthouse score and a CrUX number can disagree, and both can be right, because they answer different questions. Lesson 3.3, Lab data vs field data, explains why.
Chrome, Firefox and Safari for testing
Most of those tools live in Chrome. But your visitors don't all use Chrome. Every browser has an engine: the part that reads a page and draws it. There are three big ones:
- Blink, in Chrome and Edge;
- Gecko, in Firefox;
- WebKit, in Safari.
Remember the recipe from lesson 1.3? It was written in a restaurant kitchen, and took far longer on a small hob at home. Three engines are three different kitchens. The same page can be quick in one and slow in another. So check your important pages in all three.
First, find out what each browser can measure. Browsers hand their measurements to JavaScript as entries. Each entry has a type, such as "largest-contentful-paint" for LCP. This example asks your browser, the one you're reading this in, which types it has:
const types = PerformanceObserver.supportedEntryTypes;const vitals = [ ["LCP", "largest-contentful-paint"], ["INP", "event"], ["CLS", "layout-shift"],]; for (const [vital, type] of vitals) { console.log(`${vital}: ${types.includes(type) ? "this browser reports it" : "not reported here"}`);}- Line 1 reads
PerformanceObserver.supportedEntryTypes.PerformanceObserveris the browser's tool for watching entries arrive; lesson 11.1, The performance timeline, covers it.supportedEntryTypesis its list of the entry types this browser can report. - Lines 2 to 6 pair each Core Web Vital with the entry type it's built from. INP is built from
"event"entries: the browser's timings of taps, clicks and key presses. - Lines 8 to 10 go through the three pairs. Line 9 prints whether the list has that type.
Press Edit & run. In Chrome or Edge, it prints this browser reports it three times. Other browsers don't report all three:
Each row of this table is one browser, its tool for recording a page load, and the Core Web Vitals it reports, with the first version that does:
| Browser | Tool for recording a load | Core Web Vitals it reports |
|---|---|---|
| Chrome and Edge | DevTools' Performance panel, with live metrics, and Lighthouse. | LCP (77), INP (96) and CLS (77). |
| Firefox | The Firefox Profiler, which is the Performance tab of Firefox's DevTools. | LCP (122) and INP (144). Not CLS. |
| Safari | The Timelines tab of Safari's Web Inspector. | LCP and INP (26.2). Not CLS. |
This panel runs a fuller check in your own browser. Open this page in another browser to compare:
const types = PerformanceObserver.supportedEntryTypes;const hasInteractionId = "PerformanceEventTiming" in window && "interactionId" in PerformanceEventTiming.prototype; showList(types);showVitals({ lcp: types.includes("largest-contentful-paint"), inp: types.includes("event") && hasInteractionId, cls: types.includes("layout-shift"),});Checking what your browser can measure…
In the panel's code:
- Line 1 reads the entry types, as in the first example.
- Line 2 checks for
interactionId. One tap fires several events, such aspointerdown,pointerupandclick. INP groups them into one interaction by giving them the same id number,interactionId. So a browser needs it to report INP, not only event entries. - Lines 4 to 9 show the list, and whether each Core Web Vital can be measured.
Firefox and Safari have their own recording tools too: the Firefox Profiler and Safari's Timelines tab. Lesson 9.5, More lab tools, shows both. Why it matters: measure CLS in Chrome or Edge, and check LCP and INP in all three.
DevTools settings for performance work
Ravi's laptop is much faster than Asha's phone. DevTools can slow it down, so it acts more like her phone. That only helps if it's slowed by the right amount, and the same way every time.
Before you trust a new bathroom scale, you put a bag of rice on it that you know weighs 5 kg. If it says 6, you adjust it until it says 5. From then on, you weigh yourself on the same scale, in the same spot, so this week's number compares with last week's.
- In real life: The bag of rice you know weighs 5 kg
- In web performance: A low-tier or mid-tier phone: the speed you want to copy
- In real life: Adjusting the scale until it reads 5 kg
- In web performance: Calibrating: DevTools measures your computer, then works out how much to slow it
- In real life: The same scale, in the same spot, every week
- In web performance: The same settings for every measurement, written in your log
Here is the adjusting, in DevTools. Its CPU slowdown setting makes your computer's processor, the chip that runs the code, work slower on purpose. But "4 times slower" is measured from your own computer's speed. A fast laptop and an old one, both slowed 4 times, still end up at different speeds.
So since Chrome 134, DevTools can calibrate. It measures your computer first, then works out how much to slow it. After that, it offers two settings that act like a low-tier and a mid-tier phone.
Calibrating is one setting of several. Each row of this table is one setting, where to find it, and why it matters:
| Setting | Where | Why |
|---|---|---|
| A clean window | Open an Incognito window, or a Guest profile. | Extensions run their own code on every page. A clean window keeps their work out of your numbers. |
| Disable cache | Tick it in the Network panel, or in the Performance panel's environment settings. | Every reload becomes a first visit, with nothing saved from before. |
| CPU slowdown | The Performance panel's environment settings: CPU. | Makes your computer act like a slower phone. Since Chrome 134, DevTools can calibrate it to act like a low-tier or a mid-tier phone. |
| Network | The same settings: Network. | Slow 4G, or a custom profile of 9 Mbps down, 3 Mbps up and a 100 ms round trip: lesson 1.3's 75th percentile visitor. |
| A phone-sized screen | The device toolbar, in Device mode. | The page lays out as it does on a phone, so the same element becomes the LCP. |
| Field data | The Performance panel: Field data, Set up. | Shows your real visitors' CrUX numbers beside yours, and suggests settings closer to theirs. |
| Screenshots | The Performance panel's capture settings. | Saves a filmstrip of the page with every recording. |
Two words from the table need explaining. The browser's cache is where it keeps files from earlier visits. With the cache off, every reload is a first visit, like Asha's. Field data in the Performance panel means your real visitors' CrUX numbers, shown next to yours.
Firefox and Safari can slow things down too. Firefox's Network Monitor has network presets, from GPRS to Wi-Fi. Its docs warn that they give an approximate idea, not exact measurements. Safari's Web Inspector records loads and interactions in its Timelines tab.
Every time you measure: an Incognito window, the cache off, the CPU slowed, Slow 4G or the 9 Mbps, 3 Mbps, 100 ms custom network, and a phone-sized screen. This course slows the CPU 4 times, as Lighthouse does. The calibrated mid-tier phone is closer to a real phone. Pick one, and write your list in your log.
Why it matters: if two numbers in your log used different settings, you can't compare them. That's the trap from the first example.
The course's slow store
Ravi now has tools and settings. He still shouldn't practice on the real shop. If a fix goes wrong, Asha and every other customer would see it.
A cooking school has a practice kitchen. Students can burn a dish there, try again, and burn it again, and no customer goes hungry. When a dish finally comes out right, they know how to cook it for real.
- In real life: The practice kitchen
- In web performance: The course's slow store, a copy of the tea shop made for practice
- In real life: Burning a dish, with no customer waiting
- In web performance: Breaking the store while you try a fix, with no real visitors
- In real life: Tasting each try against the first dish
- In web performance: Measuring each fix against the store's baseline
- In real life: Cooking it for real later
- In web performance: Using the same fix on your own sites
The course's practice page is the slow store. It's the Leaf and Kettle tea shop again, built from the first three lessons:
- the shop page and its styles from lesson 1.1;
- the heavy picture from lesson 1.2;
- the list of 1,800 teas from lesson 1.3.
Then it got one problem on purpose for each of three qualities from lesson 1.1: loading, responding and stability. Here is its HTML:
<!doctype html><html lang="en"><head> <meta charset="utf-8"> <meta name="viewport" content="width=device-width, initial-scale=1"> <title>Leaf and Kettle</title> <link rel="stylesheet" href="styles.css"> <script src="app.js"></script></head><body> <header>Leaf and Kettle</header> <div id="news"></div> <main> <img id="hero" src="hero.svg" alt="A glass of mint tea" width="360" height="270"> <h1>Mint tea</h1> <p>Fresh mint leaves, picked this week. 120 grams, 450 cents.</p> <button id="add">Add to cart</button> <p id="cart">Cart: 0</p> <section id="teas"></section> </main></body></html>- Line 8 loads
app.js, the store's script, inside the<head>. It has nodeferorasync, so it's a classic script. When the browser meets it, it stops reading the HTML. It downloads the script, runs it, and only then reads on. Nothing can be drawn until then. Lesson 5.3, Render-blocking and parser-blocking resources, explains why. - Line 12 is an empty box with the id
news. A promotion appears in it later. - Line 14 is the picture: the heavy one from lesson 1.2. It weighs 580 KB, because of a texture of 14,000 dots.
And its script, shortened:
const catalog = [ { name: "Mint No. 1", garden: "Assam", notes: "bright and fresh", cents: 250 }, { name: "Green No. 1", garden: "Nilgiri", notes: "citrus and honey", cents: 1169 }, // … 1,798 more teas …]; document.addEventListener("DOMContentLoaded", () => { buildIndex(); showTeas(24); let count = 0; document.querySelector("#add").addEventListener("click", () => { count = count + 1; document.querySelector("#cart").textContent = `Cart: ${count}`; // Every click rebuilds the index and draws all 1,800 teas again. buildIndex(); showTeas(catalog.length); }); // A promotion that arrives a second later, with no space kept for it. setTimeout(() => { document.querySelector("#news").innerHTML = '<p class="promo">Free delivery on every order this week. Use the code LEAF at checkout.</p>'; }, 1000);}); // Start-up work, like building a search index: sort 200,000 past order prices.function buildIndex() { const prices = Array.from({ length: 200000 }, (_, i) => (i * 7919) % 1000); return prices.sort((a, b) => a - b);} function showTeas(howMany) { const sorted = [...catalog].sort((a, b) => a.cents - b.cents); const cards = sorted.slice(0, howMany).map((tea) => `<article><h2>${tea.name}</h2><p>${tea.garden}: ${tea.notes}. ${tea.cents} cents.</p></article>`); document.querySelector("#teas").innerHTML = cards.join("");}- Lines 1 to 5 are the catalog, the list of 1,800 teas from lesson 1.3. Only two are shown here.
- Line 7 waits until the browser has read all the HTML. That moment has a name:
DOMContentLoaded. - Lines 8 and 9 do the start-up work: build a search index, then show the 24 cheapest teas.
- Lines 12 to 18 run on every click of Add to cart. Lines 13 and 14 update the cart. Then lines 16 and 17 do the start-up work all over again, for all 1,800 teas, though only the cart changed.
- Lines 21 to 23 add a promotion one second later, above everything else, with no space kept for it.
- Lines 27 to 36 are the two functions behind the start-up work. The first sorts 200,000 prices. The second sorts the catalog and draws a card for each tea.
Its problems, one by one:
- Loading: app.js is a classic script in the head, so the page can't be drawn until it has downloaded and run.
- Loading: The picture, the main content, is 580 KB, because of a texture of 14,000 dots.
- Responding: Each click on Add to cart rebuilds the index and draws all 1,800 teas again.
- Stability: A promotion arrives a second after the page is ready, above the content, with no space kept for it.
Open the store in a new tab and try it. It's published on this site, exactly as it's measured below. Later lessons load this same store. Lesson 7.1 records it in the Performance panel, and lesson 8.2, The Lighthouse score, scores it.
Run the store on your computer
Opening the store on this site is enough to measure it. To change it, you need your own copy. That takes three steps:
- Make a folder called
leaf-and-kettle. - Save the store's four files into it: index.html, styles.css, app.js and hero.svg.
- Start a small web server in the folder. A web server is a program that hands files to the browser when it asks, the way a real site's server does.

With Node.js installed, two commands do it:
cd leaf-and-kettle
npx serve .
Line 1 goes into the folder. Line 2 runs serve, a small web server from npm. npx fetches it from npm and runs it, without adding it to a project. It prints the address to open, usually http://localhost:3000. localhost means your own computer.
With Python instead:
cd leaf-and-kettle
python3 -m http.server 8000
Line 2 starts Python's built-in web server on port 8000. A port is like a numbered door on your computer, and the server waits behind door 8000. So the store is at http://localhost:8000.
Why not just double-click index.html? A file opened straight from the disk skips the network completely, so a server is closer to the real thing. Even a local server is very fast, though: the files never leave your computer. So always turn on the network slowdown in DevTools when you measure locally.
Take your first baseline
Now Ravi can measure. Before he changes anything, he measures the store with fixed settings. That first measurement is the baseline: the first cake, before any change.
One load isn't enough, because no two loads are exactly alike. Lighthouse's docs list some reasons. Other programs on the same computer, browser extensions and antivirus software can all change the numbers. So load the page several times. Five is a common choice: the same docs say the median score of 5 runs is twice as stable as 1 run.
The median is the middle value, once the runs are in order. It's like timing your walk to the bus stop on five mornings, and quoting the middle one, not the morning a neighbour stopped you for a chat. Here are the store's five recorded loads:
// The store's five recorded loads: LCP in ms, smallest firstconst lcpRuns = [5560, 5568, 5568, 5572, 5576];const middle = lcpRuns[Math.floor(lcpRuns.length / 2)]; console.log(`The middle run: ${middle} ms`);console.log(`Fastest to slowest: ${lcpRuns.at(-1) - lcpRuns[0]} ms`);- Line 1 is a comment. The runs are already sorted, smallest first. If yours aren't, sort them first, as exercise 2 does.
- Line 2 holds the five LCP times the course recorded for the store.
- Line 3 finds the middle.
lcpRuns.lengthis 5. Half of it, rounded down byMath.floor, is 2. So it readslcpRuns[2], the third run, because counting starts at 0. - Line 5 prints
The middle run: 5568 ms. That's the store's baseline LCP. - Line 6 subtracts the fastest run from the slowest, and prints
Fastest to slowest: 16 ms.
All five runs were within 16 ms of each other. Runs aren't always this close. With other programs busy on the same computer, one run can come out much slower. The middle run barely moves when that happens, which is why the baseline uses it. Lesson 9.4, Noise and variability, measures how much runs move, and how many you need.
Here is how the course took the store's whole baseline. It loaded the store in real Chrome 156, on an Apple M1 Pro laptop, with:
- the CPU 4 times slower;
- DevTools' Slow 4G network;
- a phone-sized screen;
- nothing saved from earlier visits.
It loaded the store 5 times, and clicked Add to cart once after each load. Then it kept the load with the middle LCP. Each row of this table is one measurement from that load, with its rating:
| Measurement | Value | Rating |
|---|---|---|
| First contentful paint (FCP) | 3,092 ms | poor |
| Largest contentful paint (LCP) | 5,568 ms | poor |
| Layout shift score (CLS) | 0.14 | needs improvement |
| Add to cart click (its INP) | 296 ms | needs improvement |
| Main thread blocked by long tasks | 249 ms | no limit, a lab number |
| Bytes over the network | 736 KB | no limit, but see lesson 1.3's budgets |
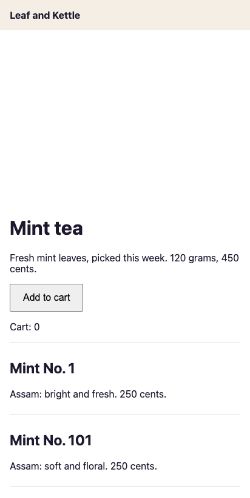
- Nothing drawn yet
0 ms to 3,092 msA blank screen
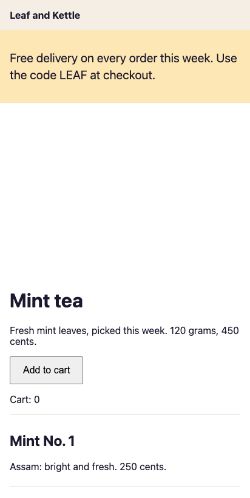
At 3,092 msText and teas, no picture
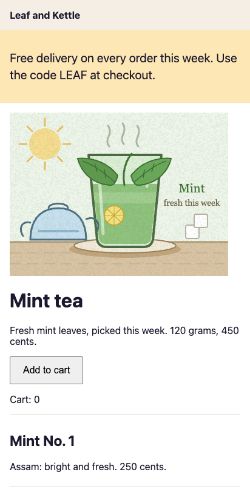
At 4,057 msThe promotion pushes it all down
At 5,569 msThe picture: the LCP
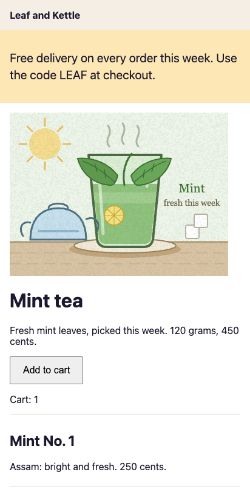
At 6,730 msAfter one click
What the numbers say, one finding at a time:
- Nothing was drawn until 3,092 ms.
app.jstook until 2,888 ms to arrive, and the page waited for it. That's the loading problem on line 8 of the HTML. - At 4,043 ms, the promotion pushed everything down: a layout shift, scored 0.14. That's the stability problem.
- The picture finished arriving at 5,271 ms, and appeared at 5,568 ms: the store's LCP. Most of that wait was the 580 KB picture crossing a slow network.
- One click on Add to cart took 296 ms to show its next frame. With only one click, that's the visit's INP. That's the responding problem.
Why it matters: these are the numbers every fix to the store will be compared with. A fix that doesn't move them didn't help.
Try it yourself. Open the store in an Incognito window, use the settings from the checklist, and reload it 5 times. Keep the middle LCP for your log, in the next section. Or download the baseline's trace, a file of everything Chrome did during that load, and open it in the Performance panel. Your numbers will differ from the course's, because your computer does. That's fine. What matters is that your baseline and your later fixes are measured the same way.
Keep a performance log
A baseline kept in your head is soon forgotten. So Ravi writes it down, like the baker's notebook. A performance log is a plain text file, such as performance-log.md in your project. It gets one entry each time you measure. It turns "I think it got faster" into "LCP went from this to that, measured the same way".
Each row of this table is one part of an entry, with the store's baseline as the example:
| Part | What it is | Example |
|---|---|---|
| Date | When you measured. | 2026-11-06 |
| Version | The commit or release you measured, so you can find the code again. | a1b2c3d |
| Change | What you changed since the last entry, or baseline for the first one. | baseline: nothing changed yet |
| Setting | Browser and version, CPU slowdown, network, screen and cache. | Chrome 156, CPU 4x slower, Slow 4G, phone screen, cache off |
| Numbers | The middle of 5 runs for each metric, with its unit. | LCP 5,568 ms, CLS 0.14, INP 296 ms |
| Notes | Anything odd, and where the traces are saved. | The five LCP runs were within 16 ms of each other. |
Here is one entry, written as a single line of text:
const entry = { date: "2026-11-06", change: "baseline: nothing changed yet", setting: "Chrome 156, CPU 4x slower, Slow 4G, cache off", lcp: 5568,}; console.log(`${entry.date} | ${entry.change} | ${entry.setting} | LCP ${entry.lcp} ms`);- Lines 1 to 6 describe one measurement as an object.
- Line 2 is the date. Line 3 says what changed: nothing yet, so this entry is the baseline.
- Line 4 is the setting, so anyone can measure the same way again. Line 5 is the middle LCP from the previous example.
- Line 8 prints the entry as one line. A bar,
|, separates the parts:2026-11-06 | baseline: nothing changed yet | Chrome 156, CPU 4x slower, Slow 4G, cache off | LCP 5568 ms.
Every later entry has the same shape. Only the change and the numbers move. When two entries are close, lesson 13.2, Proving a change worked, shows how to tell a real improvement from noise.
Now write a real entry, for the page you're reading. This panel reads this page's own load from your browser:
const [paint] = performance.getEntriesByName("first-contentful-paint");const lcp = await lastEntry("largest-contentful-paint");const cls = cumulativeLayoutShift(await allEntries("layout-shift")); writeLine(logLine({ date: today(), change: "baseline: this lesson page", setting: `${browserName(navigator.userAgent)}, this device, no slowdown`, numbers: `FCP ${paint.startTime} ms, LCP ${lcp.startTime} ms, CLS ${cls}`,}));No line yet.
Press Measure this page. The panel reads this page's own load from your browser and writes one log line.
Line 1 of the panel's code reads the first contentful paint: the first moment any text or picture appeared. Lines 2 and 3 read LCP and CLS. Lines 5 to 10 write them into one line, in the same shape as the example above.
What goes in a log entry
An entry only helps if someone can repeat it later: maybe you, three months from now. Sort each item: does it belong in the log?
- The date you measured
- The commit or release you measured
- Browser version, CPU slowdown, network and screen
- What you changed since the last entry
- The middle of 5 runs for each metric
- Only your fastest run
- The Lighthouse score, without the metrics behind it
- A number from a single run on a different laptop
Sort each item: does it belong in a performance log entry?
Common mix-ups
- "One tool tells me everything." No. Each tool answers one question. The Performance panel shows one load step by step. CrUX shows how real visits went.
- "One load tells me how fast it is." No. Loads vary. Take 5 with the same settings, and keep the middle one.
- "Firefox and Safari can't measure Core Web Vitals." No. Both report LCP and INP. Only CLS is Chromium-only.
- "Fast in Chrome means fast everywhere." No. The engines differ, and so do the devices people use them on. Check important pages in all three.
- "The Lighthouse score is my baseline." No. The score blends several metrics, and Lighthouse has changed how much each one counts over time. Log the metrics themselves.
- "Opening the page from my computer measures it." No. Local files arrive almost at once. Slow the network and the CPU in DevTools, or the numbers say nothing about your visitors.
- "A log is only for big teams." No. Without one, you can't tell which of your changes helped, even on your own.
Practice exercises
Answer first, then use the hints.
This example runs in Safari 26.2. What does its CLS line print?
const types = PerformanceObserver.supportedEntryTypes;
const vitals = [
  ["LCP", "largest-contentful-paint"],
  ["INP", "event"],
  ["CLS", "layout-shift"],
];

for (const [vital, type] of vitals) {
  console.log(`${vital}: ${types.includes(type) ? "this browser reports it" : "not reported here"}`);
}CLS: not reported here. Safari's supportedEntryTypes has largest-contentful-paint and event, but not layout-shift. So the CLS line takes the second branch. Measure CLS in Chrome or Edge.
Suppose five runs of a page came out like this, with one slow run. What does the code print?
const lcpRuns = [3100, 2900, 3000, 4400, 3050];
const sorted = [...lcpRuns].sort((a, b) => a - b);

console.log(sorted[Math.floor(sorted.length / 2)]);3050. Sorted, the 3rd of 5 runs is 3,050 ms. The slow 4,400 ms run lands at the end, so it doesn't move the middle.
Suppose a fix brings a page's middle LCP from 4,000 ms to 3,000 ms, with the same settings. What does this print?
const baseline = 4000;
const afterFix = 3000;

const better = (baseline - afterFix) / baseline;
console.log(Math.round(better * 100) + "% faster");25% faster. The fix saved 1,000 ms of 4,000 ms: 0.25. That's the line to write in the log, next to the settings.
Ravi wants to know how long the shop's real visitors waited for the main content last month, on their own phones. Does he need a lab tool or field data?
Field data. Ravi wants to know what real visitors went through, on their own phones and networks. A lab tool tests one load on one computer. CrUX, shown in PageSpeed Insights, or the web-vitals library on his own pages, answers his question.
PageSpeed Insights shows CrUX field data for a page. How many days of real visits does that data cover?
28 days. PageSpeed Insights shows real users' experiences over the previous 28-day collection period. So a fix you ship today takes up to 28 days to fully show in its field data. Your lab baseline shows the change at once.
With the CPU 4 times slower, record a click on Add to cart in the store. Or download the trace and open it in the Performance panel. Which two of the store's functions does the click spend its time in?
buildIndex and showTeas. The click handler calls both, on lines 16 and 17 of app.js. One sorts 200,000 prices, and the other draws all 1,800 teas, though only the cart changed. Stage 8 shows how to fix a slow interaction.
Check your understanding
For each question, ask: which tool answers it, and was the number measured the same way, more than once, and written down?
Question 1 of 8In the first example, the same page looks 7,064 ms faster after Ravi's change. Why?
Read the code, then predict// Two loads of the same page from lesson 1.3. Nothing in it changed. const before = { lcp: 7628, setting: "a low-end phone on 3G" }; const after = { lcp: 564, setting: "a fast laptop" }; const saved = before.lcp - after.lcp; console.log(`"My change saved ${saved} ms!"`); console.log(`Measured the same way? ${before.setting === after.setting}`);Choose an answer to see the explanation.
Question 2 of 8Which tool answers: what exactly did the browser do during this one load, and when?
Choose an answer to see the explanation.
Question 3 of 8What does the browser check example's last line print in Chrome?
Read the code, then predictconst types = PerformanceObserver.supportedEntryTypes; const vitals = [ ["LCP", "largest-contentful-paint"], ["INP", "event"], ["CLS", "layout-shift"], ]; for (const [vital, type] of vitals) { console.log(`${vital}: ${types.includes(type) ? "this browser reports it" : "not reported here"}`); }Choose an answer to see the explanation.
Question 4 of 8Why measure in an Incognito window or a Guest profile?
Choose an answer to see the explanation.
Question 5 of 8Why take a baseline from 5 runs and keep the middle one?
Choose an answer to see the explanation.
Question 6 of 8What does the last line of the median example print?
Read the code, then predict// The store's five recorded loads: LCP in ms, smallest first const lcpRuns = [5560, 5568, 5568, 5572, 5576]; const middle = lcpRuns[Math.floor(lcpRuns.length / 2)]; console.log(`The middle run: ${middle} ms`); console.log(`Fastest to slowest: ${lcpRuns.at(-1) - lcpRuns[0]} ms`);Choose an answer to see the explanation.
Question 7 of 8Which browsers can report layout shifts, and so CLS, from JavaScript?
Choose an answer to see the explanation.
Question 8 of 8In the store's recorded baseline, nothing at all was drawn until long after the HTML arrived. Why?
Choose an answer to see the explanation.
Key takeaways
- Each tool answers one question. Lab tools, such as the Performance panel, Lighthouse and WebPageTest, test one load on one computer. Field data, from CrUX or web-vitals, comes from real visits.
- Chrome, Firefox and Safari all report LCP and INP. Only Chromium browsers report CLS.
- Measure in a clean window, with the cache off, the CPU and network slowed, and a phone-sized screen. Do it the same way every time.
- The slow store has a problem for loading, responding and stability. Open it on the site, or serve its folder with
npx serve. - A baseline is the middle of several runs with fixed settings, taken before you change anything.
- The store's baseline: LCP 5,568 ms, CLS 0.14, and 296 ms for one click, on Slow 4G with the CPU 4 times slower.
- Write every measurement in a log, with its date, version, change, settings and numbers.
Remember the one-liner.
Pick the tool for the question. Then measure the same way, several times, keep the middle, and write it down.
Sources
The facts on this page come from these docs, specifications and source code:
- Chrome DevTools, Chrome for Developers.
- Open Chrome DevTools, Chrome for Developers.
- Performance panel: analyze your website's performance, Chrome for Developers.
- Introduction to Lighthouse, Chrome for Developers.
- Network and CPU throttling, the Lighthouse docs.
- WebPageTest: the code that runs webpagetest.org, Catchpoint, on GitHub.
- WebPageTest agent: supported browsers, video capture and traffic shaping, Catchpoint, on GitHub.
- locations.ini.sample: WebPageTest's location dropdown, Catchpoint, on GitHub.
- Overview of CrUX, Chrome for Developers.
- About PageSpeed Insights, Google for Developers.
- web-vitals README, Google Chrome, on GitHub.
- Rendering engine, the MDN glossary.
- PerformanceObserver.supportedEntryTypes, MDN.
- Event Timing (interactionId), W3C.
- Analyze runtime performance (why to measure in Incognito), Chrome for Developers.
- What's new in DevTools, Chrome 134 (calibrated CPU throttling), Chrome for Developers.
- Firefox Profiler documentation, Mozilla.
- Network Monitor throttling, Firefox DevTools docs.
- The Timelines tab, WebKit.
- serve, Vercel, on npm.
- npx, the npm docs.
- http.server, the Python docs.
- Score variability, the Lighthouse docs.
- First Contentful Paint, web.dev.
- Cumulative Layout Shift, web.dev.
- Lighthouse performance scoring, Chrome for Developers.
Coming next: 0.1 seconds, 1 second, 10 seconds. It looks at how people feel waits of different lengths, and the time budgets that follow for every interaction and frame.