Rendering and runtime tools
Paint flashing, layout shift regions, layers, the performance monitor, coverage, and selector stats. Each tool on a real recording of the course's store or site, with what it shows and what it leaves out.
- 01Pick the toolMatch a question about repaints, shifts, layers, memory, unused code or slow styles to the one tool that answers it.
- 02Read what it showsRead a green paint box, a tinted shift, a layer's memory estimate, the monitor's charts, a Coverage table and a Selector Stats row.
- 03Know what it leaves outSay what each tool's number counts, and what it doesn't, before you change any code because of it.
One question per tool
Asha's message is still on your desk: the Leaf and Kettle page is slow on her phone. So far, you've answered every question about it the same way. You recorded the store, then searched the recording.
A recording is the shop's security camera from The Performance panel. It catches everything, but you have to stop it and search the footage. Some questions are smaller than that. Did that click repaint the whole page? What moved when the promotion arrived? Is the page holding on to more and more memory?
For questions like these, DevTools has smaller tools. Each one answers one question, often live, while you use the page. Most of them look at one moment: a click on Add to cart. Here is the store's code for that click, from its app.js.
document.querySelector("#add").addEventListener("click", () => { count = count + 1; document.querySelector("#cart").textContent = `Cart: ${count}`; // Every click rebuilds the index and draws all 1,800 teas again. buildIndex(); showTeas(catalog.length);});- Line 1 runs the code inside each time someone clicks Add to cart.
- Lines 2 and 3 add one to the cart and show the new count, such as
Cart: 1. - Line 5 does the store's start-up work again: it sorts 200,000 past order prices.
- Line 6 draws a card for every tea in the catalog. That's all 1,800 of them. They replace the cards already on the page.
So one click throws away the list of tea cards and builds a new one, 1,800 cards long. That's a lot of drawing, new elements and style work. Each tool shows a different side of it. Here they all are, each next to the question it answers.
Leaf and Kettle's cook wants to know if the oil is hot enough to fry. Playing back the shop's camera won't tell her. So she dips a thermometer in the oil. It says 180 degrees, right now. It says nothing about the salt, or the queue at the door.
- In real life: The security camera, played back later
- In DevTools: A recording in the Performance panel
- In real life: A thermometer dipped in the oil
- In DevTools: One tool from this lesson, such as paint flashing
- In real life: "180 degrees, right now"
- In DevTools: An answer while you use the page
- In real life: Nothing about the salt
- In DevTools: What the tool leaves out
Each of these tools answers one question. Pick the one that answers yours. Then read what its number counts, and what it leaves out, before you act on it. A number read the wrong way sends you off to fix the wrong thing.
The first three tools in the picture are checkboxes on DevTools' Rendering tab. Each one draws something on top of the page. To open the tab, press Command+Shift+P on a Mac, or Control+Shift+P on Windows and Linux. That opens the Command Menu, a search box for DevTools' commands. Type rendering and pick Show Rendering.
The course turned each checkbox on for its store, in Chrome on a phone-sized screen. Each time, it took a screenshot. Pick one to see what it drew. The next two sections explain each picture.
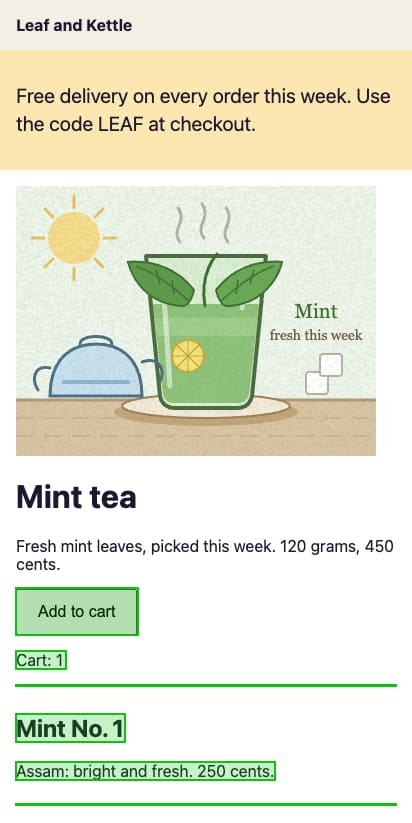
Just after a click on Add to cart. Green boxes mark what Chrome painted again: the button, the cart's count and the tea cards below. The header and the photo have no box, so they weren't painted again.
Paint flashing and layout shift regions
What did Chrome paint again?
In The pixel pipeline, you met paint: the step where Chrome works out what to draw, and draws it. Some changes need it, and some can skip it. But on a real page, which parts get painted again when you click?
Paint flashing answers that. Chrome's DevTools docs say: "With this option switched on, Chrome flashes the screen green whenever repainting happens".
Think back to redecorating the living room in lesson 6.3. Now take a photo of the room, and mark every spot you painted today with a highlighter. One glance shows what the job really touched. Say you only meant to recover a cushion. If the whole wall is covered in marks, something went wrong.
- In real life: A highlighter mark on the photo
- In DevTools: A green box from paint flashing
- In real life: The cushion you recovered
- In DevTools: A small part Chrome painted again, like the cart's count
- In real life: Marks all over a wall you meant to leave alone
- In DevTools: Green where you didn't expect a repaint
- In real life: No mark on the picture you slid along its rail
- In DevTools: A move with
transform, which can skip paint
The course turned paint flashing on and clicked Add to cart. Pick Paint flashing in the playground above to see the screenshot. Green boxes sit around three things:
- The Add to cart button.
- The cart's count, which changed from
Cart: 0toCart: 1. - The tea cards below, which line 6 of the click's code drew again.
The header and the photo of mint tea have no green box. Nothing about them changed, so Chrome didn't paint them again.
Why it matters: a repaint you didn't expect is work you can remove. The whole screen might flash, or areas you didn't think should be painted. Then the docs' advice is to "consider investigating further".
What moved?
Asha has a second complaint. About a second after the store loads, the text she's reading jumps down. That jump is a layout shift. Content already on the screen moves to a new place between one frame and the next. Core Web Vitals scores these shifts with CLS. This code causes it:
// A promotion that arrives a second later, with no space kept for it.setTimeout(() => { document.querySelector("#news").innerHTML = '<p class="promo">Free delivery on every order this week. Use the code LEAF at checkout.</p>';}, 1000);- Line 1 is a comment.
- Line 2 waits before it runs the code inside. Line 4 says how long:
1000ms, which is one second. - Line 3 puts the promotion into
#news, an empty box at the top of the page, just under the header.
Nobody kept room for the promotion, so everything below it moves down.
Layout Shift Regions shows that move. In the docs' words, "Areas of layout shift are briefly highlighted in purple". Pick it in the playground above: the screenshot was taken as the promotion arrived. Almost the whole screen is tinted, the new promotion included. Why?
Because the tint covers where the moved content was and where it is now. It's like drawing round the sofa on the floor before you move it, and again after. The course read the shift from the recording's trace:
// The promotion's layout shift, from the trace: the moved content's box as x, y, width and height, in px.const before = [0, 50, 412, 773];const after = [0, 170, 412, 653]; const top = Math.min(before[1], after[1]);const bottom = Math.max(before[1] + before[3], after[1] + after[3]);console.log(`The tint covers ${top} to ${bottom} px down the screen.`);console.log(`The content moved ${after[1] - before[1]} px down.`);- Line 1 is a comment. Each box is four numbers. They say how far from the left, how far down, how wide and how tall, in pixels (px).
- Line 2 is the moved content before the shift. It started 50 px down, just under the header.
- Line 3 is the same content after the shift. It starts 170 px down. Both boxes end at 823 px, the bottom of the phone's screen. Only the part on the screen counts.
- Line 5 takes the higher of the two tops. Line 6 takes the lower of the two bottoms.
- Line 7 prints
The tint covers 50 to 823 px down the screen. - Line 8 prints
The content moved 120 px down.
So the strip starts at 50 px, where the content used to be. The promotion now sits at its top. The promotion didn't move. Everything under it moved down 120 px to make room.
Why it matters: the tint shows what moved, not what pushed it. Here, the cause sits at the top of the strip, in the space the content left behind.
From the tint to a score
The same two boxes give the shift its score. web.dev's guide to CLS multiplies two numbers.
- The impact fraction: how much of the screen the moved content touched, before and after. That's the tinted strip.
- The distance fraction: how far the content moved, divided by the screen's longer side.
// The same shift's score: how much of the screen it touched, times how far it moved.const screen = { width: 412, height: 823 };const tinted = 823 - 50;const moved = 120; const impact = tinted / screen.height;const distance = moved / Math.max(screen.width, screen.height);console.log(`impact ${impact.toFixed(3)} × distance ${distance.toFixed(3)} = ${(impact * distance).toFixed(4)}`);console.log("The trace's score: 0.1369");- Line 2 is the phone's screen.
- Line 3 is the tinted strip's height, from the last example. Line 4 is how far the content moved.
- Line 6 is the impact fraction. The strip is as wide as the screen. So its share of the height is also its share of the area.
- Line 7 is the distance fraction. The screen's longer side is its height, 823 px.
- Line 8 multiplies the two and prints
impact 0.939 × distance 0.146 = 0.1369. - Line 9 prints the score Chrome itself recorded:
The trace's score: 0.1369. The two agree.
Most of the screen moved, but not far. DevTools' docs ask for a CLS of 0.1 or less, so this one shift is already over the limit.
A page can read these shifts too, with the Layout Instability API. Each shift arrives as a LayoutShift entry, with its score in value and what moved in sources. Turn on Layout Shift Regions in your own DevTools, then press a button.
// Report each layout shift in the box: its score, and how far each moved part went.new PerformanceObserver((list) => { for (const shift of list.getEntries()) { if (shift.hadRecentInput || !shift.sources.some(({ node }) => box.contains(node))) continue; report(shift.value, shift.sources.map(({ previousRect, currentRect }) => currentRect.y - previousRect.y)); }}).observe({ type: "layout-shift" }); // A second after the click, the banner arrives: above the list, or in a space kept for it.setTimeout(() => (keepSpace ? slot.append(banner) : list.before(banner)), 1000);- Mint No. 1
- Mint No. 101
- Chamomile No. 68
- Rooibos No. 36
Each button adds a banner above the list 1 second later, like the store's promotion. Turn on Layout Shift Regions in DevTools' Rendering tab first, to see what moved.
- Line 2 of the playground's code asks for each new shift. Line 7 names the kind of entry:
"layout-shift". - Line 4 skips shifts outside the box, and shifts with
hadRecentInput. That's true when a shift came less than 500 ms after your own input, such as a click. You expected that shift, so CLS can leave it out. - Line 5 reports the score, and how far each moved part went.
- Line 10 adds the banner a second after your click, well past those 500 ms. So the shift counts.
The Layers panel
In The pixel pipeline, Chrome split the page into layers. Layers are parts it draws on their own and then stacks, like see-through sheets on a projector. A layer can make an animation cheap, but it takes memory. So how many layers does the store have, and why?
The quick answer is on the Rendering tab. Layer borders draws a border around every layer on the page.
Back at the overhead projector, the teacher has stacked so many sheets that she's lost count. So she runs a marker round the edge of each sheet. Now one look shows how many there are, and where each one sits. If every word of her lesson has a sheet of its own, the outlines make that plain.
- In real life: A marker line round one sheet
- In DevTools: One layer's border, from Layer borders
- In real life: Counting the outlines
- In DevTools: Counting the page's layers
- In real life: A note on each sheet: why it's separate
- In DevTools: The layer's compositing reasons, in the Layers panel
- In real life: A sheet for every word of the lesson
- In DevTools: A layer for every card, each one taking memory
Layer borders also draws thin lines where tiles meet. A tile is one of the small squares that Chrome turns into pixels, one square at a time.
To learn why a layer exists, and what it costs, open the Layers panel. Its command is Show Layers panel, in the Command Menu. It lists every layer with its size. Click one to open its Details pane. Two of the things it shows matter here.
- Its compositing reasons: why Chrome gave this part of the page a layer of its own. Compositing is the step that stacks the layers into one picture.
- Its memory estimate: how much memory DevTools works out that it needs.
A layer for every card
The store, as it is, had 4 layers after loading, and none of them was a tea card. Their compositing reasons were all about scrolling and the screen. Then the course made a copy of the store with one more line of CSS.
article { will-change: transform; }Line 1 gives every tea card will-change: transform. As lesson 6.3 explained, that hints to Chrome that the card's transform will change. The course counted the card layers after loading, and after a click on Add to cart.
// Tea cards with a layer of their own, in the store with will-change on every card.const atLoad = { cards: 24, cardLayers: 24 };const afterClick = { cards: 1800, cardLayers: 35 }; console.log(`At load: ${atLoad.cardLayers} of ${atLoad.cards} cards had a layer.`);console.log(`After the click: ${afterClick.cardLayers} of ${afterClick.cards.toLocaleString("en-US")} cards had one.`);- Line 2 is the store after loading. It draws 24 cards, and every one got a layer.
- Line 3 is the store after the click. It draws all 1,800 cards, but only 35 got a layer.
- Line 5 prints
At load: 24 of 24 cards had a layer. - Line 6 prints
After the click: 35 of 1,800 cards had one.
Every card layer gave the same reason. It was "Has a will-change: transform compositing hint." But Chrome didn't make 1,800 layers. After the click, only 35 cards had one. Pick Layer borders in the first playground. You'll see the cards after loading, each with a border of its own.
What a layer costs
The memory estimate comes from a simple rule in DevTools' source code. It counts 4 bytes for every pixel of a layer that draws something. A tea card's layer is 380 by 119 px. So each of the 24 card layers added 180,880 bytes, about 181 kB, to the estimate.
Now the click. It stacks 1,800 cards into one very long page. The rule counts every pixel of it.
// The store after a click on Add to cart: one layer draws the whole page.const page = { width: 412, height: 214563 };const tilesKept = 1703936; // bytes of tiles Chrome had drawnconst mb = (bytes) => `${(bytes / 1e6).toFixed(1)} MB`; console.log(`The Layers panel's estimate: ${mb(page.width * page.height * 4)}`);console.log(`The tiles Chrome kept: ${mb(tilesKept)}`);- Line 2 is the page after the click: 214,563 px tall. One layer draws all of it.
- Line 3 is the memory the tiles really took: the squares Chrome had turned into pixels.
- Line 4 turns bytes into megabytes (MB), millions of bytes.
- Line 6 applies the rule, 4 bytes a pixel. It prints
The Layers panel's estimate: 353.6 MB. - Line 7 prints
The tiles Chrome kept: 1.7 MB.
The estimate is about 200 times what Chrome kept. Chrome cuts each layer into tiles. It only draws the tiles on the screen or close to it. It's like pricing a whole roll of wallpaper when only one strip is on the wall.
Why it matters: use the estimate to compare layers, not as Chrome's real memory. And give layers only to the few elements you really animate, as lesson 6.3 advised.
The performance monitor
Some problems only show up over time. A page gets slower the longer you use it, or its memory grows with every click. To see that, you watch numbers change while you use the page. That's the Performance monitor.
Open it with Show Performance monitor, in the Command Menu. The docs say it "displays a timeline that graphs performance metrics in real-time". Click a chart's name to show or hide it. Its charts are:
- CPU usage: how much of the time the page spent running tasks. The CPU is the chip that runs the code.
- JS heap size: how much memory JavaScript's objects take.
- DOM Nodes, JS event listeners, Documents and Document frames: how many of each the page has.
- Layouts / sec and Style recalcs / sec: how often Chrome ran layout and style.
How hard is the page working right now?
Many cars have a gauge that shows how much fuel the engine is burning right now. Press the pedal to overtake, and the needle jumps. Ease off, and it falls back. You don't stop the car to read it. You glance at it while you drive, and you learn which moves cost the most.
- In real life: The needle, glanced at while you drive
- In DevTools: The CPU usage chart, live, with no recording
- In real life: Pressing the pedal to overtake
- In DevTools: Clicking Add to cart
- In real life: The needle jumping up
- In DevTools: CPU usage rising just after the click
- In real life: The needle falling back at a steady speed
- In DevTools: CPU usage near 0% between clicks
DevTools asks the page for its numbers every half second. It turns a time, like the time spent running tasks, into a share of that half second. It turns a count, like the number of layouts, into a rate per second.
The course did the same with its store, with the CPU 4 times slower to imitate a slower phone. It read the numbers every 500 ms for ten seconds, and clicked Add to cart at 2, 4 and 6 seconds. Pick a chart:
CPU usage read 0% before the clicks. Just after each click, it read 56.3%, 59.7% and 45.7%.
Start with CPU usage. Before the first click, it sat near 0%: the page had nothing to do. Just after each click, it jumped to about half, then fell back. Each jump lines up with a click.
Why it matters: the monitor tells you when the page works hard. The docs say "a large spike in CPU usage can point to inefficient code". Record that moment in the Performance panel to learn why.
Is the page holding on to memory?
Two charts count what the page keeps. JavaScript keeps its objects in an area of memory called the heap. A node is one item in the page's DOM tree, such as an element or a piece of text.
Now and then, Leaf and Kettle counts everything in its storeroom. The count includes the old boxes stacked by the back door, waiting to be thrown out. They're only gone once the cleaner has been round. So a big count just after a delivery doesn't worry anyone. A count that keeps growing even after the cleaner's rounds does.
- In real life: Counting every box on the shelves
- In DevTools: DOM Nodes and JS heap size
- In real life: A new delivery of 1,800 boxes
- In DevTools: A click that draws 1,800 new cards
- In real life: Old boxes stacked by the back door
- In DevTools: Replaced cards that nothing uses any more
- In real life: The cleaner's round
- In DevTools: The garbage collector freeing them
In JavaScript, the cleaner is the garbage collector. MDN, Mozilla's web docs, says its job is to find memory that is "no longer needed" and take it back. It runs now and then, so old objects still count until it does. Here are the DOM Nodes readings.
// DOM Nodes in the Performance monitor: before the first click, then just after each one.const nodes = [28249, 37252, 37108, 46111]; for (let click = 1; click < nodes.length; click++) { const change = nodes[click] - nodes[click - 1]; const sign = change > 0 ? "+" : ""; console.log(`Click ${click}: ${nodes[click].toLocaleString("en-US")} nodes (${sign}${change.toLocaleString("en-US")})`);}- Line 2 holds four readings. The first is from before the first click. The others are from just after each of the three clicks.
- Line 5 works out how much each reading changed from the one before. Line 6 puts a plus sign in front of a rise.
- Line 7 prints one line per click:
Click 1: 37,252 nodes (+9,003),Click 2: 37,108 nodes (-144)andClick 3: 46,111 nodes (+9,003).
Every click draws the same 1,800 cards. Yet the first and third clicks each added 9,003 nodes, and the second took 144 away. The heap tells you why:
// JS heap size in the Performance monitor, in bytes, at the same four moments.const heap = [4927528, 7127380, 2185140, 4921668];const mb = (bytes) => `${(bytes / 1e6).toFixed(1)} MB`; console.log(`Before the clicks: ${mb(heap[0])}`);for (let click = 1; click < heap.length; click++) console.log(`Click ${click}: ${mb(heap[click])}`);- Line 2 holds the heap's size at the same four moments, in bytes. Line 3 turns bytes into MB.
- Line 5 prints
Before the clicks: 4.9 MB. - Line 6 prints one line per click:
Click 1: 7.1 MB,Click 2: 2.2 MBandClick 3: 4.9 MB.
Around the second click, the heap fell from 7.1 MB to 2.2 MB: the garbage collector had run. It freed the cards no longer on the page. So the node count fell too, even though that click had just drawn 1,800 new cards. After the third click, old cards were waiting by the back door again.
Why it matters: DOM Nodes counts every node Chrome still holds, on the page or not. So watch it over several clicks. If it falls back after the garbage collector runs, there's no leak. If it keeps climbing, something is holding on to old nodes. That's a memory leak: memory the page no longer needs, but never gives back.
Why 28,249 nodes before any click, for only 24 cards? The likely reason is the photo. It's an SVG, a picture written as thousands of shapes. Chrome reads it as a document of its own, as Reading a performance trace found.
Coverage for unused CSS and JavaScript
Every byte of JavaScript a page sends has to be downloaded, read and compiled, as The cost of JavaScript showed. To compile code is to turn it into steps the computer can run. How much of it does the page really use? The Coverage panel records which bytes of each script and stylesheet were used. That means which code ran, and which CSS rules matched an element.
Open it with Show Coverage, in the Command Menu. Pick a scope, Per function or Per block, and click Reload. The panel reloads the page and keeps recording while you use it. When you stop, its table lists each file with its total bytes and its unused bytes.
A café wants to know which recipes it could drop. So its cooks tick the ones they make this week. One cook ticks a whole recipe as soon as she starts it. Another ticks only the steps she really does, and leaves "if there's no cream, use milk" blank. And a recipe nobody made this week may be next week's favourite.
- In real life: A tick in the cookbook
- In DevTools: Bytes Coverage counts as used
- In real life: Ticking a whole recipe as soon as you start it
- In DevTools: Per function: a function counts as used once it's called
- In real life: Ticking only the steps you really did
- In DevTools: Per block: each block counts on its own
- In real life: This week's ticks
- In DevTools: What ran while Coverage was recording
In Coverage's own terms:
- Per function is the default. Once a function is called, all of its bytes count as used, even parts that never ran.
- Per block looks inside functions. A block is a stretch of code that runs as one piece, such as the inside of an
if. Each block counts as used only if it ran.
DevTools' tooltip on the scope menu explains the default: "per function has low overhead, per block has significant overhead". Overhead is the extra work the recording adds to the page.
The course's own home page
For this tool, the course used a bigger page: its own home page, https://completefrontend.com/. It recorded it the way the panel does, per function, to the end of the load.
// The course's home page at load, in the Coverage panel, per function: total and used bytes.const js = { size: 1520055, used: 1149949 };const css = { size: 219748, used: 63742 };const unused = ({ size, used }) => `${(100 - (used / size) * 100).toFixed(1)}% of ${size.toLocaleString("en-US")} bytes unused`; console.log(`JavaScript: ${unused(js)}`);console.log(`CSS: ${unused(css)}`);- Line 2 is all the JavaScript the page loaded. It holds its size, and the bytes that were used. Line 3 is the same for CSS.
- Line 4 works out the unused share and writes it as a sentence.
- Line 6 prints
JavaScript: 24.3% of 1,520,055 bytes unused. - Line 7 prints
CSS: 71.0% of 219,748 bytes unused.
Most of the CSS went unused. The docs describe a common way that happens. A page links a whole stylesheet, but uses only one part of it. Bootstrap, a popular ready-made stylesheet, is a common example.
The JavaScript looks better, with about a quarter unused. But one row in the table isn't a file. It's the page's own inline scripts, written straight into the HTML. Here, it includes data that Next.js, the site's framework, writes into the page for React. All of it ran. Take that row out:
// The same JavaScript, without the page's own row: its inline scripts, which all ran.const js = { size: 1520055, used: 1149949 };const inline = 685046; const files = { size: js.size - inline, used: js.used - inline };console.log(`JavaScript files alone: ${(100 - (files.used / files.size) * 100).toFixed(1)}% unused`);- Line 3 is the page's own row: 685,046 bytes, every one of them used.
- Line 5 takes that row out of both the size and the used bytes.
- Line 6 prints
JavaScript files alone: 44.3% unused.
Almost half of the JavaScript files' bytes didn't run during the load. Here are the biggest files:
Unused, so far
Coverage keeps recording while you use the page. So the course opened the site's search and typed in it. That loaded 2 more JavaScript files, 399,965 more bytes. It also ran code that had sat unused in a file loaded earlier.
// One of the site's JavaScript files, per function: bytes used by the end of the load, and after the search.const file = { size: 172733, usedAtLoad: 121418, usedAfterSearch: 132106 }; const late = file.usedAfterSearch - file.usedAtLoad;console.log(`${late.toLocaleString("en-US")} bytes that looked unused at load ran during the search.`);- Line 2 is one of the site's JavaScript files. It holds its size, the bytes used by the end of the load, and the bytes used after the search.
- Line 4 subtracts one from the other.
- Line 5 prints
10,688 bytes that looked unused at load ran during the search.
So "unused" means unused so far, in the clicks you made while recording. Code for the search looks like waste until somebody searches.
Why it matters: Coverage shows you where to look, not what to delete. The docs warn: "Finding unused code is relatively easy. In contrast, refactoring the codebase so that each page contains only the necessary JavaScript and CSS can be difficult".
Selector stats for slow styles
Back to the click. In The pixel pipeline, you met style recalculation. In a recording, it shows up as a Recalculate Style event. DevTools' docs say it does two jobs:
- Find all the CSS rules that match each element.
- Work out each element's final style from those rules.
A long Recalculate Style raises a question: is one of your selectors slow? A selector is the part of a CSS rule that picks the elements, like #teas article. Selector Stats answers that question, for the first job.
Turning it on
Selector Stats is off by default, "because it adds more overhead to your performance recordings". To use it:
- In the Performance panel, open Capture settings.
- Check Enable CSS selector stats.
- Record, do the slow thing, and stop.
- Click a Recalculate Style event, and open the Selector Stats tab at the bottom of the panel.
The tab lists each selector that took part, one per row. Its main columns are:
- Elapsed (ms): the time Chrome spent matching this selector.
- Match Attempts: how many elements Chrome tried it on.
- Match Count: how many of those it matched.
- % of slow-path non-matches: of the elements it didn't match, the share that needed a slow, full check.
Two new rules for the store
The course added two rules to the store's stylesheet.
/* Teas with a photo get a brown title. */#teas article:has(img) h2 { color: #6b4f1d; }/* Slightly wider letters in the main column, but not on buttons. */main *:not(button) { letter-spacing: 0.01em; } - Line 2 gives a brown title to every tea card that has a picture.
:has(img)means "that has an image somewhere inside". No tea card has a picture, so this rule matches nothing. - Line 4 spreads the letters a little for everything inside
main, except buttons.
The course loaded each version of the store five times. Each time, it clicked Add to cart once, with the CPU 4 times slower. Here are the two rules' rows, from the click with the middle Recalculate Style.
// The two new rules' rows in the Selector Stats tab, for the click's Recalculate Style.const rows = [ { selector: "#teas article:has(img) h2", elapsedMs: 3.91, attempts: 1800, matches: 0, slowPath: 100 }, { selector: "main :not(button)", elapsedMs: 0.857, attempts: 5401, matches: 5400, slowPath: 100 },]; for (const row of rows) { console.log(`${row.selector}: ${row.elapsedMs} ms, ${row.matches} of ${row.attempts} matched`);}- Lines 3 and 4 are the two rows. Each holds the selector, then Elapsed, Match Attempts, Match Count and the slow-path share.
- Line 8 prints one line per row:
#teas article:has(img) h2: 3.91 ms, 0 of 1800 matchedandmain :not(button): 0.857 ms, 5400 of 5401 matched.
The rule that matched nothing cost the most. For each of the 1,800 tea titles, Chrome had to look inside the card for an image. It's like being asked to colour the title of every card with a photo. You open all 1,800 cards, and find no photo in any.
Its slow-path share, 100%, says the same. Chrome first tries a quick check, which DevTools calls the bloom filter. The column counts the misses that "couldn't be quickly ruled out by the bloom filter due to high selector complexity". Here, every one of the 1,800 misses needed the full check.
DevTools writes the second rule without the * from line 4. It's the same rule: MDN notes that the * is optional there, so *.warning and .warning are equivalent.
Matching is only part of the cost
Did the rules make the click's Recalculate Style slower, and how much of that was matching?
// The click's Recalculate Style in ms, without and with the two rules: the middle of five clicks each.const recalc = { store: 59.2, withRules: 81.8 };const matching = 3.91 + 0.857; // the two rows' Elapsed const added = recalc.withRules - recalc.store;console.log(`The rules made Recalculate Style ${added.toFixed(1)} ms longer.`);console.log(`Matching them took ${matching.toFixed(1)} ms of it.`);- Line 2 is the click's Recalculate Style, without and with the rules: the middle of five clicks each.
- Line 3 adds up the two rows' Elapsed times.
- Line 6 prints
The rules made Recalculate Style 22.6 ms longer. - Line 7 prints
Matching them took 4.8 ms of it.
All five clicks with the rules were slower than every one without. So the 22.6 ms is real. But matching was only 4.8 ms of it. The other 17.8 ms went on the rest of the style work for the 5,401 elements the click restyled. That work sits outside the Elapsed column.
Why it matters: Selector Stats times only the matching. Before you rewrite a selector, check how much it could really save. Then change it, record again, and compare.
Which tool?
Each question below is one you might ask about a page. Sort it by the tool that answers it. Ask yourself: is it about what's drawn, how the page is layered, what changes over time, or what code ran?
- Does hovering a card repaint the whole page?
- Which part of the page moved when the banner arrived?
- Why does this element have its own layer?
- How many layers does the page have?
- Do DOM nodes keep growing as I use the page?
- Does scrolling keep the CPU busy?
- How much of this stylesheet does the page use?
- Which script ships the most code that never ran?
Sort each question by the tool that answers it.
Common mix-ups
- "Green in paint flashing means slow." No. Green means painted again, and every change is painted somewhere. Look for green where nothing changed, or for the whole screen flashing again and again.
- "The tint shows what caused the shift." No. It shows what moved: where it was, and where it went. The store's promotion sits inside the tint, but it was the content below it that moved.
- "The memory estimate is what the layers really use." No. It counts 4 bytes for every pixel. After the click, it said 353.6 MB, while the tiles Chrome kept took 1.7 MB.
- "DOM Nodes counts what's on the page." No. It counts every node Chrome still holds. After the third click, it said 46,111, for the same 1,800 cards.
- "Unused in Coverage means safe to delete." No. It means unused while Coverage was recording. The search ran code that the load didn't.
- "Selector Stats shows a rule's whole cost." No. It times the matching. Matching was 4.8 ms of the 22.6 ms the two rules added.
Here are the six numbers in one table. Read each row across: the tool, what its number counts, and what that number leaves out.
| Tool | What does it count? | What does it leave out? |
|---|---|---|
| Paint flashing | Every area Chrome painted again. | How long the painting took. |
| Layout Shift Regions | Where the moved content was, and where it went. | What pushed it. |
| The Layers panel's memory estimate | 4 bytes for every pixel of every layer that draws. | That Chrome draws tiles only near the screen. |
| DOM Nodes, in the Performance monitor | Every node Chrome still holds, on the page or not. | Which nodes are only waiting for the garbage collector. |
| Coverage | The bytes that ran or matched while it recorded. | Code that a later click, page or visitor will need. |
| Selector Stats | The time spent matching each selector. | The rest of Recalculate Style's work. |
Practice exercises
Answer first, then use the hints.
The banner is half as tall, so the content moves only 60 px. What does this print?
// A banner half as tall: the content moves 60 px.
const screen = { width: 412, height: 823 };
const tinted = 823 - 50;
const moved = 60;

const impact = tinted / screen.height;
const distance = moved / Math.max(screen.width, screen.height);
console.log(`impact ${impact.toFixed(3)} × distance ${distance.toFixed(3)} = ${(impact * distance).toFixed(4)}`);impact 0.939 × distance 0.073 = 0.0685. Half the move gives half the score, because the strip didn't change.
The same home page, recorded per block this time. What does the first line print?
// The course's home page at load, in the Coverage panel, per block: total and used bytes.
const js = { size: 1520055, used: 1033042 };
const css = { size: 219748, used: 63742 };
const unused = ({ size, used }) => `${(100 - (used / size) * 100).toFixed(1)}% of ${size.toLocaleString("en-US")} bytes unused`;

console.log(`JavaScript: ${unused(js)}`);
console.log(`CSS: ${unused(css)}`);JavaScript: 32.0% of 1,520,055 bytes unused. Per block also counts the parts of called functions that never ran.
In the first playground, what color is the border around each tea card's layer?
orange. DevTools' docs say layer borders are drawn in orange and olive, and tiles in cyan.
In the monitor playground, which chart stays flat through all three clicks?
JS event listeners. It read 28 the whole time: the cards have no listeners of their own.
Record Coverage on this lesson's page, then click a row in the table. Which DevTools panel opens, to show you which lines were used?
Sources. It opens the file and marks the lines that weren't used, next to the line numbers.
Take the inline scripts out again, per block this time. What does this print?
// The JavaScript files alone again, but per block this time.
const js = { size: 1520055, used: 1033042 };
const inline = { size: 685046, used: 685029 };

const files = { size: js.size - inline.size, used: js.used - inline.used };
console.log(`JavaScript files alone: ${(100 - (files.used / files.size) * 100).toFixed(1)}% unused`);JavaScript files alone: 58.3% unused. Per block, more than half of the bytes in the site's JavaScript files didn't run during the load.
Check your understanding
For each question, ask which tool answers it, what that tool's number counts, and what it leaves out.
Question 1 of 8What does the first line of the layout shift score example print?
Read the code, then predict// The same shift's score: how much of the screen it touched, times how far it moved. const screen = { width: 412, height: 823 }; const tinted = 823 - 50; const moved = 120; const impact = tinted / screen.height; const distance = moved / Math.max(screen.width, screen.height); console.log(`impact ${impact.toFixed(3)} × distance ${distance.toFixed(3)} = ${(impact * distance).toFixed(4)}`); console.log("The trace's score: 0.1369");Choose an answer to see the explanation.
Question 2 of 8Paint flashing puts a green box over part of the page. What does that tell you?
Choose an answer to see the explanation.
Question 3 of 8Layout Shift Regions tints the store's promotion too, as it arrives. Why?
Choose an answer to see the explanation.
Question 4 of 8What does the third line of the DOM Nodes example print?
Read the code, then predict// DOM Nodes in the Performance monitor: before the first click, then just after each one. const nodes = [28249, 37252, 37108, 46111]; for (let click = 1; click < nodes.length; click++) { const change = nodes[click] - nodes[click - 1]; const sign = change > 0 ? "+" : ""; console.log(`Click ${click}: ${nodes[click].toLocaleString("en-US")} nodes (${sign}${change.toLocaleString("en-US")})`); }Choose an answer to see the explanation.
Question 5 of 8In the recording, the store put will-change on every tea card. After it drew all the teas, how many cards had a layer of their own?
Choose an answer to see the explanation.
Question 6 of 8After a click, the JS heap size drops sharply. What most likely happened?
Choose an answer to see the explanation.
Question 7 of 8Coverage says most of a stylesheet is unused. What do you do first?
Choose an answer to see the explanation.
Question 8 of 8What does the Elapsed column of the Selector Stats tab measure?
Choose an answer to see the explanation.
Key takeaways
- A recording answers everything, later. These tools each answer one question, often live.
- Paint flashing shows what Chrome painted again. Layout Shift Regions shows what moved, not what pushed it.
- Layer borders and the Layers panel show each layer and why it exists. The memory estimate counts every pixel, not the tiles Chrome keeps.
- The Performance monitor shows when the page works hard. DOM Nodes counts nodes that aren't freed yet, so watch it over several clicks.
- Coverage shows what ran while it recorded, per function or per block. Unused isn't the same as safe to delete.
- Selector Stats times the matching, which can be a small part of a slow Recalculate Style.
Remember the one-liner.
One question, one tool: read what it counts, and what it leaves out, before you act.
Sources
The facts on this page come from these docs and source files:
- Discover issues with rendering performance, Sofia Emelianova and Kayce Basques, Chrome DevTools.
- Rendering tab overview, Sofia Emelianova, Chrome DevTools.
- Overlay domain, Chrome DevTools Protocol.
- Cumulative Layout Shift (CLS), web.dev.
- LayoutShift, MDN.
- Layers panel: Explore the layers of your website, Dale St. Marthe, Chrome DevTools.
- LayerTreeModel.ts, devtools-frontend source.
- Performance monitor panel, Dale St. Marthe, Chrome DevTools.
- PerformanceMonitor.ts, devtools-frontend source.
- PerformanceMetricsModel.ts, devtools-frontend source.
- Memory management, MDN.
- Coverage: Find unused JavaScript and CSS, Kayce Basques and Sofia Emelianova, Chrome DevTools.
- CoverageView.ts, devtools-frontend source.
- CoverageModel.ts, devtools-frontend source.
- Analyze CSS selector performance during Recalculate Style events, Sofia Emelianova, Chrome DevTools.
- TimelineSelectorStatsView.ts, devtools-frontend source.
- Universal selectors, MDN.
- How cc works: raster and tile management, Chromium docs.
Coming next: Custom tracks, annotations, and sharing. You'll put your own timings into a trace, mark up what you found, and share traces your team can open.