How the metrics are computed
Open Chrome's code that decides LCP, INP and CLS: which paints count, how a tap is timed, how a layout shift is scored, and why Firefox and Safari differ.
- 01Follow LCP inside ChromeSay which paints become candidates, how Chrome sizes them, and what it skips: flat placeholders, full-screen images, paints after input.
- 02Time a tap the way Chrome doesGroup a tap's events under one interactionId, end its clock at the frame's presentation, round it to 8 ms, and pick INP.
- 03Score layout shifts, and compare enginesWork out a shift's score by hand, build session windows, and explain why Firefox and Safari report different numbers.
One page, two browsers, two LCPs
Ravi builds the Leaf and Kettle tea shop. His real-user data, from Building a RUM pipeline, shows the three Core Web Vitals for every visit: LCP, INP and CLS. He measures them with The web-vitals library. One day, a Firefox visit shows an LCP far better than any Chrome visit. So Ravi loads the Mint tea page twice on his laptop. Once in Chrome, once in Firefox. The server is the same, and the photo arrives late both times. Here is the last LCP entry each browser reported:
// The Mint tea page, loaded once in Chrome and once in Firefox: the last LCP entry each reported.const chrome = { url: "mint.jpg", startTime: 1284 };const firefox = { url: "placeholder.png", startTime: 140 }; console.log(`Chrome: LCP at ${chrome.startTime} ms, from ${chrome.url}`);console.log(`Firefox: LCP at ${firefox.startTime} ms, from ${firefox.url}`);console.log(`Firefox's LCP is ${chrome.startTime - firefox.startTime} ms earlier`);- Line 1 is a comment. The course recorded both loads, in Chrome 157 and in Firefox 159.
- Lines 2 and 3 hold what each browser reported: the file, and the
startTimein milliseconds (ms) after the visit began. - Lines 5 to 7 print
Chrome: LCP at 1284 ms, from mint.jpg,Firefox: LCP at 140 ms, from placeholder.pngandFirefox's LCP is 1144 ms earlier.
Same page, same network, and the two numbers are more than a second apart. Which browser is right? Both are. Each one followed its own rules. A metric isn't read off the screen with a ruler. Code inside the browser computes it, and that code makes choices. This lesson reads those choices in Chrome's source, at the release the course records with. The last section comes back to Firefox's 140 ms.
Each metric's code runs at a different step of a frame. A frame is one picture on the screen. In Inside the rendering engine, you followed one frame from a script to the screen. Here are the same steps, with the place where each metric is decided:
Event Timing, the code behind INP, starts when input arrives. The layout shift tracker, behind CLS, works right after pre-paint. LCP's code notes what paint drew. Two clocks, LCP's and each event's, stop only when the frame is on the screen.
At a village show, three judges walk around the tents. One measures the biggest pumpkin. One times how fast the tea stall serves each customer. One counts how often a table wobbles. Each judge has a rulebook, and writes in the scorebook at a set moment. Another village's judges may use other rulebooks, and give the same pumpkin another score.
- In real life: The judge who measures the biggest pumpkin
- In Chrome: LCP's code: the paint detectors and the LCP calculator
- In real life: The judge with a stopwatch at the tea stall
- In Chrome: Event Timing, for INP
- In real life: The judge counting how often the tables wobble
- In Chrome: The layout shift tracker, for CLS
- In real life: Each judge's rulebook
- In Chrome: The specs, and each browser's own code
- In real life: The judges at another village's show
- In Chrome: Firefox and Safari
LCP, INP and CLS are computed by code inside the browser. Each has its own code, its own step in the frame, and its own rules. Change a rule, and the number changes. That's why the same visit can score differently in two browsers.
Which paints can become LCP
LCP is the time the largest image or block of text appeared, as How LCP works showed. The four parts of LCP split that time into parts. This section asks a different question: which element, and which moment? Inside Chrome, two pieces of code watch every paint. The image detector notes each image the first time it paints. The text detector does the same for each block of text. Each note is called a record. Then Chrome's LCP calculator picks among the records.
Size is the area you can see
A record's size is the area you can see, in pixels. On the load, the paragraph's text covered 331 by 42 pixels: 13,902. The photo covered 344 by 229: 78,776. For images, Chrome checks more than size. Here is the code:
uint64_t size = mapped_visual_rect.size().GetArea();if (size >= viewport_area) { result.is_viewport_covered = true; return result;}if (bounding_client_area > natural_area) { size = static_cast<double>(size) * natural_area / bounding_client_area;}constexpr double kMinimumEntropyForLCP = 0.05;result.entropy = media_timing.ContentSizeForEntropy() * 8.0 / size;result.is_min_entropy_met = result.entropy >= kMinimumEntropyForLCP;In plain words, line by line:
- Line 1: the size starts as the visible area of the image.
- Lines 2 to 5: if the image covers the whole viewport, the part of the page you can see, mark it. Chrome treats it as a background, and it can't be LCP.
- Lines 6 to 8: if the image is stretched bigger than its own pixels, shrink the size back down.
- Line 9: the least detail an image may have, 0.05 bits per pixel.
- Line 10: the file's bits for each pixel shown. That's its bytes, from its Content-Length, times 8, divided by the size.
- Line 11: the image has enough detail only at 0.05 or more. Otherwise it can't be a candidate.
Chrome calls this number entropy. A photo has lots of detail, so it needs many bytes. A flat colour has almost none, so a tiny file can fill a big box. A comment just above line 9 says the spec uses 0.032 instead. The code decides: in Chrome, the line is 0.05.
Working it out for the placeholder
On the load, two images take turns in the photo's box. While the photo downloads, a flat green PNG fills the box. Here is Chrome's test, done by hand:
// The photo's box on the page, and the two files that fill it, in bytes (their Content-Length).const box = 344 * 229;const bitsPerPixel = (bytes) => (bytes * 8) / box;const files = { "placeholder.png": 158, "mint.jpg": 9047 }; for (const [name, bytes] of Object.entries(files)) { const bits = bitsPerPixel(bytes); console.log(`${name}: ${bits.toFixed(3)} bits per pixel, ${bits >= 0.05 ? "counts" : "skipped"}`);}- Line 2 is the box's area, 344 by 229 pixels.
- Line 3 turns a file's bytes into bits per pixel.
- Line 4 holds the two files' sizes, as the server sent them.
- Lines 6 to 9 print
placeholder.png: 0.016 bits per pixel, skippedandmint.jpg: 0.919 bits per pixel, counts.
The placeholder is far under 0.05. So Chrome never makes it a candidate, though it was the largest thing on the screen for over a second. Here is the load, frame by frame:
Why it matters: in Chrome, a flat placeholder can't hide a slow photo. LCP waits for the real thing.
Entries only grow, and removed content stays
Each frame, the calculator takes its largest new record. It writes a new LCP entry only if that record is larger than the last entry. So LCP entries only ever grow.
What if the largest content leaves the page? The course recorded a second version of the page. A big sale banner covers the top. Then the page's own script removes it, 1.5 s after the load. Chrome kept the banner's entry, at 640 ms. The photo and the text were smaller, so nothing replaced it. Once the banner was gone, the entry's element became null. Chrome's changelog says this rule started in Chrome 88. The spec names the cost: pages with splash screens can get an LCP for content that left.
One case is different. If an element is removed before its frame reaches the screen, its record never becomes a candidate.
Chrome leaves out a few more kinds of paint:
- Background images on
<body>or<html>are never recorded. - An image waits until it's loaded before its record counts.
- Text in a fully transparent colour, with no shadow or outline, isn't recorded.
- Nothing counts after the first tap, click, key press or scroll. Chrome drops its LCP code for the page right there. Mouse moves and a lone key release don't stop it.
- Chrome only checks detail for images from the page's own origin, or sent with CORS. A flat image from another site, without CORS, skips the check. Chrome's comment says this stops a page learning another site's file sizes.
Step through the two visits. Each frame is real, and each decision is the one Chrome made:
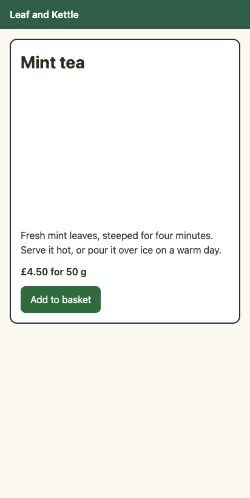
What happened: The heading, the paragraph, the price and the button paint. The photo's box is still empty.
New LCP entry: the paragraph, 13,902 pixels, the largest thing painted so far. startTime 112 ms.
A village holds a tallest-sunflower contest. A judge measures each sunflower when it opens. The board only changes when a new one beats the record. A sunflower cut down later keeps its record. A cardboard sunflower, painted flat green, doesn't count. When the gates open to visitors, judging stops.
- In real life: Measuring a sunflower when it opens
- In Chrome: A record, when an image or text first paints
- In real life: Writing it on the board only if it beats the record
- In Chrome: A new LCP entry only when it's larger than the last
- In real life: A cut-down sunflower keeping its record
- In Chrome: Removed content stays the LCP
- In real life: A flat cardboard sunflower
- In Chrome: An image under 0.05 bits per pixel
- In real life: The gates opening to visitors
- In Chrome: The first tap, click, key press or scroll
Why it matters: a splash screen, or a big banner that goes away, can make Chrome's LCP look better than what Asha actually waited for. Check which element your LCP entry names.
Two times for every paint
When Chrome writes an LCP entry, which time does it use? Every paint has two. First, the main thread finishes its part of the frame. The HTML standard calls this step mark paint timing, near the end of updating the rendering. Chrome notes the time right there. But the frame still has a trip to make: the commit, raster and Viz, from lesson 42.2. Only then is it on the screen.
The Paint Timing spec names both times. paintTime is when the main thread finished. presentationTime is when the frame was presented: shown to the user. Here is where Chrome fills them in:
DOMPaintTimingInfo paint_timing_info{ .paint_time = performance->MonotonicTimeToDOMHighResTimeStamp( record.rendering_update_end_time), .presentation_time = performance->MonotonicTimeToDOMHighResTimeStamp( frame_timing_details.presentation_feedback.timestamp)};bool coarsen = !performance->CrossOriginIsolatedCapability();if (coarsen) { paint_timing_info.presentation_time = (frame_timing_details.presentation_feedback.timestamp - performance->GetTimeOriginInternal()) .CeilToMultiple(base::Milliseconds(4)) .InMillisecondsF();}In plain words, line by line:
- Line 1: start a record of this frame's paint times.
- Lines 2 and 3: the paint time is when the rendering update ended.
- Lines 4 to 6: the presentation time is when Viz reported the frame on the screen. Chrome waits for that report.
- Line 7: is the page cross-origin isolated? Most pages aren't.
- Lines 8 to 14: if not, round the presentation time up to the next multiple of 4 ms. Chrome's changelog says this lowers the risk of a page reading details of other sites' images.
An LCP entry's startTime is the presentation time. Here are the load's two entries:
// The load's two LCP entries in Chrome, in ms after the visit began.const entries = [ { element: "p.about", paintTime: 77.6, presentationTime: 112, startTime: 112 }, { element: "img", paintTime: 1262.8, presentationTime: 1284, startTime: 1284 },]; for (const entry of entries) { const later = (entry.presentationTime - entry.paintTime).toFixed(1); console.log(`${entry.element}: on the screen ${later} ms after its paint`);}console.log(entries.every((entry) => entry.startTime === entry.presentationTime));console.log(entries.map((entry) => entry.presentationTime % 4).join(", "));- Lines 3 and 4 are the two entries Chrome reported, with both times.
- Lines 7 to 10 print
p.about: on the screen 34.4 ms after its paintandimg: on the screen 21.2 ms after its paint. - Line 11 prints
true: eachstartTimeis the presentation time. - Line 12 prints
0, 0: both times are multiples of 4.
The trace holds the exact times: 109.5 ms and 1,282.8 ms. Chrome rounded them up to 112 and 1,284. It also waits until the rounded time before it hands the entry to the page. The page's observer got the photo's entry at 1,284.8 ms.
You post a birthday card at nine. That's the postmark. It lands on your friend's doormat at eleven, and only then does your friend see it. The post office delivers in rounds, so it writes down the round, not the exact minute.
- In real life: The postmark, when you post the card
- In Chrome: paintTime: the main thread finished the frame
- In real life: The card on your friend's doormat
- In Chrome: presentationTime: the frame on the screen
- In real life: Writing down the delivery round, not the minute
- In Chrome: Rounding up to the next 4 ms
Why it matters: in Chrome, LCP includes the frame's whole trip to the screen. A slow raster or a busy GPU makes LCP later, even after the main thread is done. The same trip is the presentation delay of INP.
How Chrome times a tap
Asha taps Add to basket. The header changes to Basket: 1. How does Chrome turn that tap into a number? First, it has to know which events belong to the tap. One tap fires many: pointerdown, mousedown, pointerup, mouseup, click and more. Event Timing reports each one, as Event Timing and INP showed. An interactionId ties together the ones that belong to one tap.
The course clicked the button twice with the mouse, from a script, so press and release came 0.4 ms apart. Here is the first click, to scale, with two real frames of the header:
Three of the five events got the id 5273. The mouse events got 0. The second click got 5280: 7 higher. Here is the code that hands out the ids:
if (event_type == event_type_names::kPointerdown) { pending_pointerdown_entries_.Set(pointer_id, new_entry); return;}if (event_type == event_type_names::kPointerup) { if (pending_pointerdown_entry) { interaction_id_for_pointerid = AssignNewPointerInteractionId(pointer_id); SetInteractionId(pending_pointerdown_entry, *interaction_id_for_pointerid); } SetInteractionId(new_entry, interaction_id_for_pointerid.value_or( PerformanceTimelineEntryIdInfo::kNone)); return;} if (interaction_id_for_pointerid) { SetInteractionId(new_entry, *interaction_id_for_pointerid);In plain words, line by line:
- Lines 1 to 4: a pointerdown gets no id yet. It waits, because the finger might start a scroll.
- Lines 5 to 10: at the pointerup, make a new id, and give it to the waiting pointerdown.
- Lines 11 to 14: give the pointerup the same id. A pointerup with no pointerdown before it gets 0.
- Lines 15 and 16: the click that follows reuses the pointer's id.
If the finger starts a scroll, a pointercancel comes instead, and the pointerdown gets 0. Chrome runs this code just before each event's handlers start, from window_performance.cc. The ids start at a random number from 100 to 10,000, and go up by 7. So don't count taps from the ids. performance.interactionCount counts them for you.
The clock stops at the screen
Each event's duration starts at its timeStamp, the moment of the input. It ends at the presentation time of the next frame. Then Chrome rounds it:
timing->presentation_time = presentation_details.presentation_feedback.timestamp;// Round to 8ms.int rounded_duration = std::round((event_end_time - event_creation_time).InMillisecondsF() / 8) * 8;In plain words, line by line:
- Lines 1 and 2: when the next frame is on the screen, write its presentation time on the event.
- Line 3 is Chrome's comment: round to 8 ms.
- Lines 4 to 6: take the end minus the event's timestamp, divide by 8, round, and multiply by 8.
The trace keeps the exact durations. Round them yourself:
// The two clicks' exact durations, from Chrome's trace (ms).const exact = [94.185, 44.193];const roundTo8 = (ms) => Math.round(ms / 8) * 8; console.log(exact.map(roundTo8).join(" and "));- Line 2 holds the two clicks' exact durations, from Chrome's trace.
- Line 3 rounds to the nearest multiple of 8, as line 5 of Chrome's code does.
- Line 5 prints
96 and 48, the durations the page saw.
The first click took 94.2 ms from the press to the screen. Its handlers ran for 40.6 ms of that. About 8.8 ms went before them, and 44.7 ms after them, until the frame was on the screen. Those are the input delay, the processing and the presentation delay from The three phases of an interaction. Chrome keeps an event in the page's buffer only at 104 ms or more. An observer can ask for shorter ones, down to 16 ms.
From interactions to INP
An interaction's latency is its longest event, as How INP works showed. For a whole visit, Chrome keeps the 10 slowest interactions. Then it skips one for every 50 interactions. With fewer than 50, INP is the slowest. The course clicked Add to basket 60 times in a row. Two of the clicks did extra work. Here is Chrome's rule, as a small model:
// Chrome's INP rule, as a small model of interaction_to_next_paint_calculator.cc.function inp(slowestTen, interactions) { const index = Math.min(slowestTen.length - 1, Math.floor(interactions / 50)); return slowestTen[index];}// The 10 slowest of the course's 60 clicks, longest first (ms).const slowestTen = [304, 200, 80, 48, 48, 48, 48, 48, 40, 40]; console.log(`After 49 clicks: ${inp(slowestTen, 49)} ms`);console.log(`After 60 clicks: ${inp(slowestTen, 60)} ms`);- Lines 2 to 5 are the rule. Line 3 picks the place in the list as Chrome's code does: one step down for every 50 interactions, and never past the 10 Chrome keeps.
- Line 7 holds the 10 slowest of the 60 recorded clicks.
- Line 9 prints
After 49 clicks: 304 ms. Under 50, nothing is skipped. - Line 10 prints
After 60 clicks: 200 ms. 60 / 50 rounds down to 1, so the slowest click is skipped.
That's how INP becomes a high percentile without sorting every interaction. web.dev describes it as ignoring "one highest interaction for every 50 interactions". Slide the playground to change how many clicks count:
- click 12304 msskipped
- click 37200 msINP
- click 180 ms
- click 248 ms
- click 948 ms
- click 1048 ms
- click 1148 ms
- click 1548 ms
- click 340 ms
- click 440 ms
60 clicks count. 60 / 50 rounds down to 1, so Chrome skips the slowest one and reports click 37: 200 ms.
At a busy café, you order at the counter. Your order gets one number, and every ticket for it carries that number: the drink, the cake, the bill. The café times each order from the moment you ask until the tray is on your table. At night, the manager looks at the slowest order, but forgives one slow order for every 50 served.
- In real life: One order number on every ticket
- In Chrome: One interactionId on pointerdown, pointerup and click
- In real life: From asking until the tray is on your table
- In Chrome: From the input's timestamp to the frame on the screen
- In real life: Forgiving one slow order for every 50
- In Chrome: Skipping one slowest interaction for every 50
Here are four numbers from this lesson, and when each one's clock stops. Read each row across:
| The number | Its clock stops when | How Chrome rounds it |
|---|---|---|
An LCP entry's startTime | The frame with the element is on the screen. | Up to the next multiple of 4 ms. |
An LCP entry's paintTime | The main thread finished the rendering update for that frame. | No extra rounding. |
An event entry's duration | The next frame after the handlers is on the screen. | To the nearest multiple of 8 ms. |
A layout shift's startTime | Pre-paint finished, in the frame where things moved. | No extra rounding. |
Why it matters: INP's clock runs until the pixels are on the screen. Fast handlers aren't enough; the frame after them must be quick too.
Scoring one layout shift
Now the page moves. A second after the load, a promo bar appears under the header: Free delivery on orders over £20. The whole card jumps down. How CLS works gave the formula: impact fraction times distance fraction. Here is where Chrome computes it, and what it measured for this shift.
First, what counts as moving. Chrome tracks where each element's corner sits, its starting point. A move under 3 CSS pixels, both across and down, doesn't count. A move's distance is the larger of the two. For each element that moved, Chrome adds its old place and its new place to one region. Then, after pre-paint:
double viewport_area = double(viewport.width()) * double(viewport.height());double impact_fraction = region_.Area() / viewport_area;double viewport_max_dimension = std::max(viewport.width(), viewport.height());double move_distance_factor = (frame_max_distance_ < viewport_max_dimension) ? double(frame_max_distance_) / viewport_max_dimension : 1.0;double score_delta = impact_fraction * move_distance_factor;In plain words, line by line:
- Line 1: the viewport's area, without scrollbars.
- Line 2: the impact fraction is the region's area over the viewport's area.
- Line 3: the viewport's longer side.
- Lines 4 to 7: the distance fraction is the largest move over that side, and never more than 1.
- Line 8: the score is the two multiplied.
For the promo bar, the card moved 60 pixels. Its old and new places together covered 380 by 567 pixels. Here are both frames, and the region, from Chrome's trace:
// The first shift, from Chrome's trace, in CSS pixels: the region the card covered before and after, and how far it moved.const viewport = { width: 412, height: 823 };const region = { width: 380, height: 567 };const moved = 60; const impact = (region.width * region.height) / (viewport.width * viewport.height);const distance = moved / Math.max(viewport.width, viewport.height);console.log(`impact ${impact.toFixed(4)}, distance ${distance.toFixed(4)}`);console.log((impact * distance).toFixed(5));- Lines 2 to 4 are the recorded numbers: the viewport, the region and the move.
- Lines 6 and 7 are the two fractions, as in Chrome's code.
- Line 8 prints
impact 0.6354, distance 0.0729. - Line 9 prints
0.04633. Chrome's entry said 0.046326.
Hand and engine agree. The card was big, so the impact was big. It only moved 60 pixels, so the distance was small.
You slide a big sofa across the living room, one step. Look at the floor it covered, before and after: a big patch. But it only moved one step. A small stool dragged from wall to wall covers little floor, yet travels far.
- In real life: The floor the sofa covered, before and after
- In Chrome: The impact region
- In real life: The whole floor
- In Chrome: The viewport
- In real life: How far it slid, against the longest wall
- In Chrome: The distance fraction
Why it matters: a big element scores high even for a short move. Keep space free for anything that arrives late above a big block.
From shifts to CLS
The shift page moved four times. Each time, Chrome reported a layout-shift entry:
- At 1,024 ms, the promo bar pushes the card down. Value 0.0463.
- At 1,424 ms, a rating line pushes the photo, the text and the button down. Value 0.0175.
- At 3,051 ms, the course clicks Show details, and the details push the button down. Value 0.0055, with
hadRecentInputtrue. - At 4,624 ms, a stock line pushes the button down. Value 0.0014.
Input turns the score off for 500 ms
A mouse press, a key press, a tap, or letting go of the mouse or a finger starts a 500 ms timer. While it runs, every shift gets hadRecentInput true. Chrome still reports the entry, but doesn't add its value. The third shift came less than 5 ms after the click.
Shifts while a finger or mouse button is still down wait too. Chrome holds them until the release, and the release starts the timer first. So dragging something doesn't add to CLS.
Session windows
Chrome groups the rest into session windows. A shift starts a new window if it comes more than 1 s after the last one, or more than 5 s after the window began (the rule, the two sizes). CLS is the largest window. This code runs in Chrome's browser process, which records the page's CLS. Here it is as a small model:
// Chrome's session windows, as a small model of layout_shift_normalization.cc.function largestWindow(shifts) { let start = -Infinity, last = -Infinity, sum = 0, largest = 0; for (const { at, value } of shifts) { if (at - last > 1000 || at - start > 5000) { start = at; sum = 0; } last = at; sum += value; largest = Math.max(largest, sum); } return largest;}// The shifts without recent input, at ms after the visit began.const shifts = [{ at: 1024, value: 0.0463 }, { at: 1424, value: 0.0175 }, { at: 4624, value: 0.0014 }];console.log(largestWindow(shifts).toFixed(4));- Lines 2 to 11 are the model. Line 5 starts a new window after a 1 s gap, or after 5 s.
- Line 8 keeps the largest total so far.
- Line 13 holds the three shifts without recent input.
- Line 14 prints
0.0638. The first two shifts, 400 ms apart, share a window. The last came 3.2 s later, on its own.
The Layout Instability spec only sketches CLS as a sum of every shift. The session windows come from Chrome, and from web.dev's definition of CLS. Try both rules, and the input rule, on the four recorded shifts:
| Shift | At | Value | hadRecentInput | Window |
|---|---|---|---|---|
| The promo bar | 1,024 ms | 0.0463 | false | window 1 |
| The rating line | 1,424 ms | 0.0175 | false | window 1 |
| The details, after the click | 3,051 ms | 0.0055 | true | not counted |
| The stock line | 4,624 ms | 0.0014 | false | window 2 |
Shifts within 500 ms after input don't count. A window ends after a 1 s gap, or after 5 s. CLS is the largest window. 2 windows; the largest is window 1.
Why it matters: a burst of small shifts adds up. A shift that a tap asked for, right after the tap, costs nothing. What causes layout shifts and Debugging CLS show how to find the shifts that do count.
Why other browsers report different numbers
Back to Firefox's 140 ms. The Interop project is where browser makers agree on what to fix together. Its Interop 2025 round chose LCP and INP as a focus area. CLS was left out.
The course loaded the same pages in Playwright's builds of Firefox 159 and WebKit 27.2. WebKit is the engine inside Safari. Playwright is a tool that drives real browsers from a script. Same laptop, same server, same clicks. Pick an engine:
largest-contentful-paint reportedevent reportedlayout-shift reported
| LCP entry | Size | startTime | paintTime | presentationTime |
|---|---|---|---|---|
| p | 13,902 | 112 | 77.6 | 112 |
| img (mint.jpg) | 78,776 | 1,284 | 1,262.8 | 1,284 |
| First click's event | interactionId | duration |
|---|---|---|
| pointerdown | 5273 | 96 ms |
| mousedown | 0 | 96 ms |
| pointerup | 5273 | 96 ms |
| mouseup | 0 | 96 ms |
| click | 5273 | 96 ms |
2 LCP entries on the load; the last one is the img (mint.jpg) at 1,284 ms. The two clicks took 96 ms and 48 ms. It reports all three entry types.
Four differences explain the numbers:
- They counted the flat placeholder. Firefox and WebKit both wrote an LCP entry for it. In Firefox, the photo then filled the same box, so it wasn't larger, and it never got an entry. Firefox's LCP stayed at 140 ms. In WebKit, the photo measured 13 pixels more than the placeholder, so it got its own entry, at 1,332 ms.
- No presentation time. Both set
presentationTimetonull. Paint Timing allows a browser without presentation times to use the paint time instead. So their LCP stops when the main thread finishes the frame, before its trip to the screen. - A different end for events. The Event Timing spec ends a duration when the rendering update is done. Chrome ends it later, when the frame is on the screen. For the same two clicks, with 40 ms of work each, Chrome reported 96 and 48 ms. Firefox reported 48 and 40, and WebKit 40 and 40.
- No layout shifts. Neither engine lists
layout-shiftin its supported entry types. There is no CLS to compare.
What they share: all three gave pointerdown, pointerup and click one interactionId, and each next click's id was 7 higher. It's like three referees who agree on the rules of the game, but stop their watches at different whistles. Here is every difference side by side. Read each row across:
| Question | Chrome 157 | Firefox 159 | WebKit 27.2 |
|---|---|---|---|
Reports layout-shift entries | Yes. | No. | No. |
| Last LCP entry on the load | The photo, at 1,284 ms. | The flat placeholder, at 140 ms. | The photo, at 1,332 ms. |
An LCP entry's presentationTime | When the frame was on the screen, rounded up to 4 ms. | null. | null. |
| The two clicks, as INP sees them | 96 ms and 48 ms. | 48 ms and 40 ms. | 40 ms and 40 ms. |
| One id for pointerdown, pointerup and click | Yes. The next click's id is 7 higher. | Yes. The next click's id is 7 higher. | Yes. The next click's id is 7 higher. |
Why it matters: never mix engines in one LCP or INP number. Compare each engine with itself over time, as Field data from every browser showed. Firefox's 140 ms isn't a faster page. It's a different rule.
Does Chrome count it?
Each item below is a paint, an event or a shift from this lesson's pages. Sort it by whether Chrome counts it toward LCP, INP or CLS:
- A flat placeholder image, 0.016 bits per pixel, for LCP
- The photo, painted after the paragraph and larger than it, for LCP
- A banner that became the LCP entry and was then removed
- A large image that paints after Asha taps the page, for LCP
- A background image on <body>, for LCP
- The pointerup of a tap, for INP
- The mousedown of a click, for INP
- A pointerdown that turns into a scroll, for INP
- A shift 300 ms after a click, for CLS
- A box that moves 2 pixels, for CLS
- A promo bar that pushes the card down a second after the load, for CLS
Sort each paint, event or shift by whether Chrome counts it.
Common mix-ups
- "LCP is the largest element on the page when it finishes loading." No. It's the largest paint Chrome counted before the first input. A removed element can stay LCP.
- "Every image can be LCP." No. Full-viewport images, images under 0.05 bits per pixel, and background images on the body never count in Chrome.
- "LCP's time is when the main thread painted." No. In Chrome, it's the presentation time, rounded up to a multiple of 4 ms. The paint time comes earlier.
- "Each event of a tap is its own interaction." No. The pointerdown, pointerup and click share one id. Mouse events get 0.
- "INP is always the slowest interaction." No. Chrome skips one slowest for every 50 interactions.
- "CLS adds up every shift on the page." No. It's the largest session window. Shifts within 500 ms of input aren't counted.
- "Firefox and Safari measure the same numbers as Chrome." No. In the recording, Firefox and WebKit counted the flat placeholder, used the paint time, and reported no layout shifts.
Practice exercises
Answer first, then use the hints.
Ravi tries a blurred preview of the photo in the same box. What does this program print?
const box = 344 * 229;
const bitsPerPixel = (bytes) => (bytes * 8) / box;
const preview = 400; // a blurred preview of the photo, in bytes

console.log(bitsPerPixel(preview) >= 0.05 ? "counts" : "skipped");skipped. 400 bytes are 3,200 bits, about 0.041 bits per pixel. That's under 0.05, so Chrome wouldn't count the preview.
Two events took 19.9 ms and 20.1 ms. What does this program print?
const roundTo8 = (ms) => Math.round(ms / 8) * 8;

console.log(`${roundTo8(19.9)} and ${roundTo8(20.1)}`);16 and 24. Math.round rounds 2.4875 down to 2 and 2.5125 up to 3. Then each is multiplied by 8.
In the INP playground, count all 60 clicks. Which click number does Chrome report as INP?
Click 37. With 60 clicks, Chrome skips the slowest click and reports the second slowest.
The last shift moved only the button. What does this program print?
const viewport = { width: 412, height: 823 };
const region = { width: 132, height: 80 };
const moved = 36;

const impact = (region.width * region.height) / (viewport.width * viewport.height);
const distance = moved / Math.max(viewport.width, viewport.height);

console.log((impact * distance).toFixed(5));0.00136. Only the button moved, 36 pixels, so both fractions are small. Chrome's entry for this shift said 0.0014.
Open the course's copy of the basket page in Chrome. Click Add to basket three times, and nothing else. Then run performance.interactionCount in DevTools' console. What does it print?
3. performance.interactionCount counts distinct interactions. It doesn't depend on the random ids.
A ticker shifts the page every 0.8 s. What does this program print?
// Chrome's session windows, as a small model of layout_shift_normalization.cc.
function largestWindow(shifts) {
  let start = -Infinity, last = -Infinity, sum = 0, largest = 0;
  for (const { at, value } of shifts) {
    if (at - last > 1000 || at - start > 5000) { start = at; sum = 0; }
    last = at;
    sum += value;
    largest = Math.max(largest, sum);
  }
  return largest;
}
const shifts = [0, 800, 1600, 2400, 3200, 4000, 4800, 5600].map((at) => ({ at, value: 0.01 }));
console.log(largestWindow(shifts).toFixed(2));0.07. The first window holds the seven shifts from 0 to 4,800 ms. The shift at 5,600 ms starts a new window, worth only 0.01.
Check your understanding
For each question, ask which code decides the number, and when its clock stops.
Question 1 of 8What does the bits-per-pixel loop print first?
Read the code, then predict// The photo's box on the page, and the two files that fill it, in bytes (their Content-Length). const box = 344 * 229; const bitsPerPixel = (bytes) => (bytes * 8) / box; const files = { "placeholder.png": 158, "mint.jpg": 9047 }; for (const [name, bytes] of Object.entries(files)) { const bits = bitsPerPixel(bytes); console.log(`${name}: ${bits.toFixed(3)} bits per pixel, ${bits >= 0.05 ? "counts" : "skipped"}`); }Choose an answer to see the explanation.
Question 2 of 8Which time does Chrome put in an LCP entry's startTime?
Choose an answer to see the explanation.
Question 3 of 8A sale banner became the LCP entry. Then the page removed it. What does Chrome do?
Choose an answer to see the explanation.
Question 4 of 8Which events of one tap share a non-zero interactionId in Chrome?
Choose an answer to see the explanation.
Question 5 of 8A page had 120 interactions. Which one does Chrome report as INP?
Choose an answer to see the explanation.
Question 6 of 8A shift happens 300 ms after Asha clicks Show details. What happens to it?
Choose an answer to see the explanation.
Question 7 of 8Why did Firefox report an LCP of 140 ms on the load?
Choose an answer to see the explanation.
Question 8 of 8What puts two shifts in different session windows?
Choose an answer to see the explanation.
Key takeaways
- Chrome records each image and text block when it first paints. A new LCP entry needs a larger record.
- Full-viewport images, images under 0.05 bits per pixel, transparent text, and paints after input never become LCP. Removed content stays.
- Every paint has a paint time and a presentation time. Chrome's LCP uses presentation, rounded up to 4 ms.
- A tap's pointerdown, pointerup and click share one
interactionId. Durations run to the next frame on the screen, rounded to 8 ms. - INP is the slowest interaction, skipping one for every 50.
- A shift scores impact times distance. Shifts within 500 ms of input don't count. CLS is the largest session window.
- Firefox and WebKit counted the flat placeholder, gave no presentation time and reported no layout shifts, so their numbers differ.
Remember the one-liner.
Every Core Web Vital is a rule run by the browser's own code at one step of a frame: know the rule before you trust the number.
Sources
The facts on this page come from these specs, docs and source files. Chromium's are at the release the course records with:
- Largest Contentful Paint, W3C Web Performance Working Group.
- Largest Contentful Paint (LCP), web.dev.
- largest_contentful_paint_calculator.cc: LCP candidates and their size, Chromium source, 157.0.8103.52.
- image_paint_timing_detector.cc: when an image is recorded, Chromium source, 157.0.8103.52.
- text_paint_timing_detector.cc: when text is recorded, Chromium source, 157.0.8103.52.
- Largest Contentful Paint changelog, Chromium docs, 157.0.8103.52.
- LCP ignores low-entropy images (Chrome 112), Chromium docs, 157.0.8103.52.
- Removed content stays an LCP candidate (Chrome 88), Chromium docs, 157.0.8103.52.
- Paint Timing, W3C Web Performance Working Group.
- HTML Standard: update the rendering, WHATWG.
- paint_timing.cc: paint time, presentation time, and input, Chromium source, 157.0.8103.52.
- Coarsened render times for cross-origin images (Chrome 133), Chromium docs, 157.0.8103.52.
- Event Timing, W3C Web Performance Working Group.
- Interaction to Next Paint (INP), web.dev.
- responsiveness_metrics.cc: interaction ids, Chromium source, 157.0.8103.52.
- window_performance.cc: event timing and the LCP entry, Chromium source, 157.0.8103.52.
- interaction_to_next_paint_calculator.cc: INP's high percentile, Chromium source, 157.0.8103.52.
- Layout Instability, WICG.
- Cumulative Layout Shift (CLS), web.dev.
- layout_shift_tracker.cc: scoring a shift, and recent input, Chromium source, 157.0.8103.52.
- layout_shift_normalization.cc: session windows, Chromium source, 157.0.8103.52.
- Interop 2025: Core Web Vitals, The Interop project.
- WebKit Features for Safari 26.2, WebKit.
- Firefox 122 for developers, MDN.
- Firefox 144 for developers, MDN.
- Browser compatibility data, MDN.
Coming next: Deep tracing with Perfetto. You've read the code behind each number. Next, record whole traces and ask them questions.