Project: fix a slow store
Take the course's slow store from failing to passing Core Web Vitals: a lab and field baseline, then LCP, CLS, INP and a third party, fixed one at a time.
- 01Take a baseline in the lab and the fieldMeasure the store several times under one lab setting, read its p75s from many visits, and compare both with Google's lines.
- 02Fix one problem at a timeFor each Core Web Vital and the third party: measure, find the cause with the right tool, change one thing, then measure again.
- 03Report the before and afterWrite the project up the way lesson 40.2 taught, from the recorded numbers, with what changed, what didn't, and what comes next.
From failing to passing, one fix at a time
Asha opens the Leaf and Kettle store on her phone, on the bus. For three seconds, the screen stays white. Then the words appear, with an empty space where the picture of mint tea should be. A yellow promotion slides in at the top and pushes everything down. The picture comes last, after six and a half seconds. She taps Add to cart. Nothing happens for a third of a second.
This is the course's slow store, from lesson 1.4. Ravi built it with one problem for loading, one for responding and one for stability. Since then, it has also gained a chat widget, like the one in lesson 24.1. Ravi has met every fix it needs, somewhere in this course. So which one comes first? And how will he know that each one worked?
Here is where the project ends. These are the store's numbers in the lab, before and after:
// The store in the lab: the middle of 5 loads, before and after the projectconst before = { LCP: 6508, INP: 352, CLS: 0.14 };const after = { LCP: 1260, INP: 48, CLS: 0 };const good = { LCP: 2500, INP: 200, CLS: 0.1 }; for (const metric of ["LCP", "INP", "CLS"]) { console.log(`${metric}: ${before[metric]} before, ${after[metric]} after. Good is up to ${good[metric]}.`);}- Line 1 is a comment. The lab is the course's own computer, set up to act like Asha's phone. Each number is the middle of 5 loads.
- Lines 2 and 3 hold the three Core Web Vitals. LCP is when the biggest picture or text appeared, in ms. INP is how long a tap took to show its result, in ms. CLS is a score for how much the page jumped.
- Line 4 holds Google's line for "good" for each one.
- Lines 6 to 8 print one line per metric. The first is
LCP: 6508 before, 1260 after. Good is up to 2500.
All three numbers crossed their lines. Here is what that looks like on the phone's screen. These are real frames, at the same moments, before the project and after it:
So how do you get from the top row to the bottom one? Not by changing everything at once.
You tell a mechanic that your car feels slow. She doesn't start by changing parts. She drives it first, and writes down what it does. Then she finds the cause with the right tool, changes one part, and drives it again. If she changed three parts at once, she couldn't tell which one helped.
- In real life: The first test drive, written down
- In web performance: The baseline: the store's numbers before any change
- In real life: The right tool for each noise
- In web performance: DevTools' insights, the trace, and the web-vitals attribution
- In real life: Changing one part
- In web performance: One change to the store's files
- In real life: Another test drive, on the same road
- In web performance: Measuring again, the same way as before
Fix a slow page in a loop: measure, find the cause with the right tool, change one thing, and measure again the same way. Start with a baseline from the lab and the field. End with a report that shows the before and the after.
The project has four steps, one per problem, and then a report:
- Step 1, LCP: the picture comes last.
- Step 2, CLS: the promotion pushes the page down.
- Step 3, INP: Add to cart is slow to answer.
- Step 4, third parties: the chat widget costs every visit.
Each step uses a fix from an earlier lesson, and links to it. Do each step on your own copy of the store as you read, and measure it the way lesson 1.4 showed.
How the course recorded it
- The store: one version before the steps, and one after each step. Each was served over HTTPS from the course's computer, at made-up addresses: shop.example for the store and chat.example for the widget. The files went out as they are, with no compression, as in lesson 1.4.
- The lab: Chrome 157 as Asha's phone. That's Lighthouse's phone screen, DevTools' Slow 4G network and the CPU 4× slower. Each version loaded 5 times, taking turns, after one round that wasn't kept. Each load waited for the page to settle, then tapped Add to cart with the mouse. DevTools' own trace engine read every trace.
- The field: 120 visitors the course simulated, 84 on phones and 36 on computers. Each one got its own CPU speed and network, drawn the way lesson 13.1 drew them. Each visitor met the store twice: once before the project and once after it. That's 240 visits.
- The numbers: every visit and every lab load sent its own numbers home with the web-vitals library. The course added that small script to every version while recording. The published copies leave it out.
Measure the store before you change it
A baseline is a page's numbers before you change anything. Ravi takes two. The lab baseline helps him see why the store is slow. The field baseline tells him how slow it is for real visitors. Lesson 3.3 showed why you need both.
The project's store
The project starts from lesson 1.4's store, file for file. It adds one line, near the end of the page:
<section id="teas"></section> </main> <script src="https://chat.example/widget.js" async></script></body>- Lines 1 and 2 are the end of the store's page, as lesson 1.4 left it.
- Line 3 is new. It loads lesson 24.1's chat widget from another site, chat.example. Code from another site is a third party. With
async, the browser downloads it without stopping, and runs it as soon as it arrives.
Get your copy now. Each version of the store is published in its own folder, so you can compare it with yours after each step. Lesson 1.4 showed how to serve the files on your computer. Save page.html as index.html:
- Before: page.html, styles.css, app.js and hero.svg.
- After LCP: page.html, styles.css, app.js and hero.svg.
- After CLS: page.html, styles.css, app.js and hero.svg.
- After INP: page.html, styles.css, app.js and hero.svg.
- After third parties: page.html, styles.css, app.js and hero.svg.





The widget's address is the stand-in from lesson 24.1. Only the course's recorder answered it. On your copy, its request fails, so the widget never runs. Step 4 reads its cost from the recorded trace instead.
The lab baseline
Ravi loads the store 5 times in the lab, and keeps the middle value of each number. The playground below holds the store's numbers before the project and after each step, with the frames of each one's middle load. Start on Before:
Before- First contentful paint (FCP)2,948 ms
- Largest contentful paint (LCP)6,508 ms
- Add to cart's INP352 ms
- Layout shift score (CLS)0.14
- Long tasks during the load5, 974 ms in all
- Add to cart starts working3,084 ms
- Bytes over the network865 KB
7 frames 7 msa blank screen
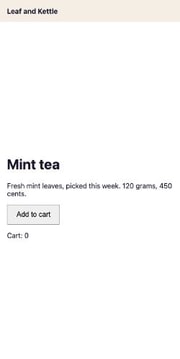 2,952 msthe words, with an empty space for the picture
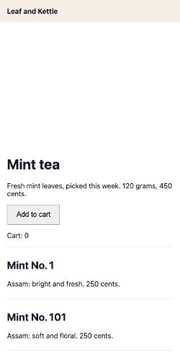 3,105 msthe words and the first teas, but no picture
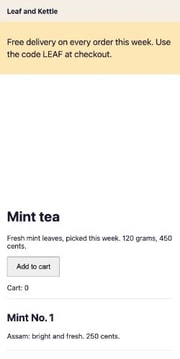 4,104 msthe promotion, which pushed the words down
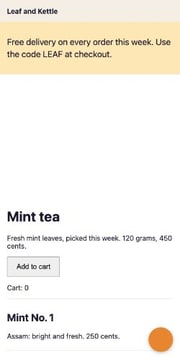 6,038 msthe promotion and the chat bubble, but no picture
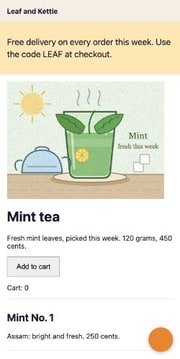 6,506 msthe picture, at last
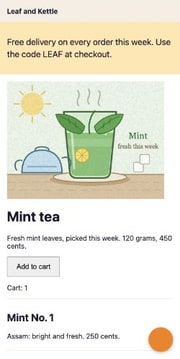 7,625 msthe whole page, with Cart: 1 after the tap
Lesson 1.4's store, plus the chat widget from lesson 24.1. Nothing is fixed yet.
Before any fix, LCP was 6,508 ms: poor. Add to cart took 352 ms, and CLS was 0.14. Both of those need improvement. Click through the other versions to see where the project goes. Why it matters: every step is compared with these numbers, measured the same way.
The field baseline
The lab is one phone on one network. Real visitors use many. So Ravi also needs field data: numbers from real visits. Google rates a page by the 75th percentile of its visits, the p75. Three visits in four were at that number or better. Lesson 3.4 explained why. Here are the p75s of the store's field sample, before the project:
// The store's field baseline: the p75 of its visits, before any fixconst p75 = { LCP: 3508, INP: 344, CLS: 0.14 };const good = { LCP: 2500, INP: 200, CLS: 0.1 }; const over = Object.keys(p75).filter((metric) => p75[metric] > good[metric]);console.log(`Over the line: ${over.join(", ") || "none"}`);console.log(over.length ? "The store fails Core Web Vitals." : "The store passes Core Web Vitals.");- Line 2 holds the p75 of the 120 visits before the project, for each metric.
- Line 3 holds Google's good lines.
- Line 5 keeps each metric whose p75 is over its line.
- Line 6 prints
Over the line: LCP, INP, CLS. Line 7 printsThe store fails Core Web Vitals.
To pass, all three p75s must be at or under their lines. The store failed all three. Read the table across: each row is one metric.
| Metric | Lab: middle of 5 loads | Field: p75 of the visits | Google's good line |
|---|---|---|---|
| LCP | 6,508 ms | 3,508 ms | 2,500 ms |
| INP | 352 ms | 344 ms | 200 ms |
| CLS | 0.14 | 0.14 | 0.1 |
Look at LCP. The field's p75 was 3,508 ms, much less than the lab's 6,508 ms. 72 of the 84 phones in the sample had a faster network than Slow 4G. The lab setting is a slow phone on a slow network, on purpose. It makes each problem big and easy to see. Why it matters: use the lab to find causes, and the field to say how many visitors are hurt.
Every visit over a line came from a phone: all 84 of them. None of the 36 visits from computers was over any line. Lesson 12.5 showed why you split visits by device.
The field also says where to look. The RUM script sends attribution with each number: which element it was about. On every visit, the LCP element was #hero, the picture. Every tap was on #add. And the largest shift always moved html>body>main, the main area. Each one points at a step of the project.
Step 1: the picture comes last
Measure. In the lab, the picture appeared at 6,508 ms. That's LCP, and Google's line is 2,500 ms.
Find the cause. LCP has four parts, one after another (lesson 17.2). Each part points at a different fix. DevTools' LCP breakdown insight shows them for any trace. The web-vitals attribution build sends the same four parts from every visit. Here they are for the middle load:
// The picture's LCP in four parts (ms), from the RUM script's attributionconst parts = { "time to first byte": 563.8, "resource load delay": 43, "resource load duration": 5496.2, "element render delay": 405,};const biggest = Object.keys(parts).reduce((a, b) => (parts[a] >= parts[b] ? a : b));console.log(`Biggest part: ${biggest}, ${parts[biggest]} ms`);- Lines 2 to 7 hold the four parts, in ms. Added up, they make the LCP.
- Line 8 finds the biggest part.
- Line 9 prints
Biggest part: resource load duration, 5496.2 ms.
Almost all of the wait was the picture downloading. It weighs 580 KB, because of a texture of 14,000 tiny dots, from lesson 1.2. The dots are so faint you can hardly see them.
A shop sends you a small parcel in a wardrobe-sized box. The van takes all day. The shop learns, and sends the next one in an envelope. It arrives in the morning, but sits on the doormat. Your door stays locked until someone finishes reading a long letter aloud. Unlock the door first, and the envelope comes straight in.
- In real life: The wardrobe-sized box
- In web performance: The 580 KB picture, heavy with its texture
- In real life: The same parcel in an envelope
- In web performance: The picture without the texture
- In real life: The door, locked until the letter is read
- In web performance: app.js, a classic script in the head
- In real life: Unlocking the door first
- In web performance: The defer attribute on app.js
Change one thing. Ravi exports the same picture without the texture. The file goes from 580,632 bytes to 2,819. Lesson 18.5 shows how to slim an SVG.
Measure again. LCP fell to 2,388 ms. That's under the line, but only just. And the parts changed shape. Now the biggest was the element render delay, 1,176 ms. The picture arrived, then waited.
What for? For app.js, a classic script in the head, on line 8 of index.html. The browser can't draw anything until it has downloaded and run that script (lesson 5.3). So the first paint and LCP came together, at 2,388 ms.
Change one more thing. It takes one word:
<!-- index.html, line 8, before the change --><script src="app.js"></script> <!-- line 8 after it: one word added --><script src="app.js" defer></script>- Line 2 is the old line 8: a classic script, which stops the page until it has run.
- Line 5 is the new line 8.
defertells the browser to download the script without stopping, and to run it once the page has been read.
The store's code waits for DOMContentLoaded anyway, so it still works. Lesson 17.4 took apart a script in the head like this one.
Measure again. LCP fell to 1,256 ms. The element render delay fell to 20 ms. Here are the three middle loads, split into their four parts and drawn to scale:
Each change fixed the part it aimed at, and showed the next one. Two changes measured together would have hidden that.
Did anything else move? CLS stayed at 0.14 and INP at 344 ms: the next two steps. But one number got worse. Add to cart started working later: at 3,160 ms, not 2,516 ms. Why? A classic script in the head starts at high priority. With defer, app.js starts low, like the async chat widget (lesson 5.4). So the two now share the slow network, and app.js finished at 2,876 ms instead of 2,330 ms. Step 4 wins that back.
Check your copy. This viewer shows every line each step changed:
−1 +1- 66
<title>Leaf and Kettle</title> - 77
<link rel="stylesheet" href="styles.css"> - 8
<script src="app.js"></script>(removed) - 8
<script src="app.js" defer></script>(added) - 99
</head> - 1010
<body>
−14,002 +0- 2727
<text x="300" y="132" font-family="Georgia, serif" font-size="20" fill="#3f6f31" text-anchor="middle">Mint</text> - 2828
<text x="300" y="154" font-family="Georgia, serif" font-size="14" fill="#6b5a3e" text-anchor="middle">fresh this week</text> - 29
<g fill="#3f6f31" opacity=".08">(removed) - 30
<circle cx="0.1" cy="160.7" r="0.9"/>(removed) - 31
<circle cx="75.4" cy="65.1" r="0.9"/>(removed) … 13,998 more lines like these …- 14030
</g>(removed) - 1403129
</svg>
Red lines left the store, green lines joined it. The grey lines around them didn't change. The numbers are line numbers before and after the step.
Step 2: keep room for the promotion
Measure. After step 1, CLS was 0.14 in all 5 loads, over the 0.1 line. One layout shift each time: a jump of content that nobody asked for.
Find the cause. Each layout shift lists the elements it moved, and where they were before and after (lesson 30.4). The web-vitals attribution build reports the largest shift: when it happened, and the first element it moved, in page order:
// The largest layout shift, from web-vitals' attribution buildconst shift = { element: "html>body>main", at: 4165, top: [50, 170] }; console.log(`${shift.element} moved down ${shift.top[1] - shift.top[0]} px at ${shift.at} ms`);- Line 2 holds its report from the middle load: the element, when it moved, and its top edge before and after, in px.
- Line 4 prints
html>body>main moved down 120 px at 4165 ms.
The whole main area moved down 120 px, a second after the store's code ran. That's the promotion. A second after DOMContentLoaded, app.js puts it into the empty #news box, above everything (lesson 30.2). On the phone's screen, the promotion is 120 px tall.
One tool guessed wrong. DevTools' Layout shift culprits insight named the picture, as an "Unsized image element". Its docs call that a best guess. Chrome counts a picture as unsized unless its CSS fixes both its width and its height, and the store's CSS says height: auto. But the width and height in the HTML already keep the picture's room. And it had been on screen for nearly three seconds. It was painted again only because it moved. Why it matters: check what a tool blames against when the jump happened and what moved.
Your friend is running late for a film. You put your coat on the seat next to you. When she arrives, she sits down, and nobody else in the row has to move.
- In real life: Your coat on the empty seat
- In web performance: #news { min-height: 120px; }
- In real life: The friend who comes late
- In web performance: The promotion, a second after the page is ready
- In real life: The whole row shuffling along
- In web performance: The layout shift
Change one thing. Keep the room from the start, as lesson 30.3 did for an ad:
/* styles.css, a new last line: keep the promotion's room */#news { min-height: 120px; }Line 1 is a comment. Line 2 gives the empty box a min-height: it's at least 120 px tall from the start. When the promotion arrives, it fills that room. Ravi also updates the comment above the promotion in app.js, so it stays true.
Measure again. CLS was 0 in all 5 loads. Pick After CLS in the playground above. Its frames show the empty room first, then the promotion inside it.
On a computer, the promotion fits on one line, so it's shorter than 120 px. It leaves a small gap, and nothing moves. In the field sample after the project, every visit from a computer had a CLS of 0. Why it matters: keep room for the tallest thing that can arrive. A smaller one leaves a gap, not a jump.
Step 3: a tap that only updates the cart
Measure. A tap on Add to cart took 352 ms to show its result. With one tap, that's the visit's INP. It needs improvement.
Find the cause. INP has three parts (lesson 26.2). The input delay waits for the main thread. The processing runs the tap's code. The presentation delay draws the new screen. For the middle load, they were 2 ms, 176 ms and 174 ms. Almost nothing waited. The time went on the store's own code, and on drawing what it changed.
Whose code? The trace's flame chart under the click names the functions (lesson 26.3). buildIndex ran for 130 ms, and showTeas for 35 ms. Here is the tap's handler:
document.querySelector("#add").addEventListener("click", () => { count = count + 1; document.querySelector("#cart").textContent = `Cart: ${count}`; // Every click rebuilds the index and draws all 1,800 teas again. buildIndex(); showTeas(catalog.length);});- Line 1 runs the function on every click of Add to cart.
- Lines 2 and 3 count the click and show it: the only change Asha needs.
- Line 4 is a comment. Line 5 sorts 200,000 prices again. Line 6 draws all 1,800 teas.
Neither the prices nor the teas had changed. The list even grew from 24 teas to 1,800, below the screen, though nobody asked for that. Drawing them was the long presentation delay.
You buy one packet of tea. Before handing you the receipt, the assistant counts every box in the stockroom. Then they rewrite the whole price list. Nothing in the stockroom changed. You only wanted your receipt.
- In real life: Handing over the receipt
- In web performance: Showing Cart: 1
- In real life: Counting every box in the stockroom
- In web performance: buildIndex sorting 200,000 prices
- In real life: Rewriting the whole price list
- In web performance: showTeas drawing 1,800 teas
- In real life: The customer, waiting at the till
- In web performance: INP
Change one thing. Delete lines 4 to 6. The fastest work is work you skip (lesson 27.3). If some of it were needed, you'd show the change first, then yield (lesson 28.1).
Measure again. INP fell to 40 ms. Processing fell to 4 ms, and the list stays at 24 teas.
The field sample tells the same story from real taps. Its INP attribution includes the longest script that ran during the tap, from the Long Animation Frames API (lesson 11.5). On every visit before the project, it was app.js, started by BUTTON#add.onclick, during processing.
Step 4: the chat widget waits for a tap
Measure. After step 3, all three Core Web Vitals were good in the lab. But the trace still showed 3 long tasks during the load: stretches of 50 ms or more when the main thread can't answer a tap. Together they took 607 ms. Whose were they?
Find the cause. DevTools' 3rd parties insight groups a trace's work by who owns the code. For this store, chat.example sent 129 KB and kept the main thread busy for 447 ms. That's the chat widget (lesson 24.1). It sets itself up, asks its server for its settings, then draws its bubble. And its bytes share Asha's network with the store's own app.js.
A small shop has a helper who stands by the door all day, in everyone's way, though few customers need help. So the owner puts a bell on the counter. The helper comes out only when someone rings it.
- In real life: A helper standing by the door all day
- In web performance: The widget, loaded on every visit
- In real life: The bell on the counter
- In web performance: The facade: a button that looks like the bubble
- In real life: Ringing the bell
- In web performance: Tapping the bubble, which loads the real widget
- In real life: Customers who never ring
- In web performance: Visitors who never chat, and pay nothing for it
Change one thing. A facade is a light copy of a widget that loads the real one only when tapped (lesson 24.2). It replaces line 21 of index.html:
<button class="chat-bubble" type="button" aria-label="Chat with Ravi"></button><script> document.querySelector(".chat-bubble").addEventListener("click", (event) => { const widget = document.createElement("script"); widget.src = "https://chat.example/widget.js"; document.body.append(widget); event.currentTarget.remove(); }, { once: true });</script>- Line 1 is a button that looks like the widget's bubble.
styles.cssgets the bubble's style too. - Lines 3 to 8 run on the first tap only, because of
once: trueon line 8. - Lines 4 to 6 add the real widget's script. Line 7 removes the facade.
Measure again. chat.example was gone from the trace. One long task was left: the store's own start-up work, 165 ms. The page downloaded 129 KB less. And with the network to itself, app.js finished at 2,161 ms instead of 2,869 ms. So Add to cart started working at 2,322 ms instead of 3,153 ms. LCP stayed about the same: 1,260 ms. The picture had already appeared before the widget arrived.
Why it matters: a third party can cost a lot and still not move the three vitals in one test. Count its bytes and its time on the main thread too.
Before and after: the report
Four steps are done. First, each step against the number it set out to move, in the lab:
Each step moved its own number a long way. The other Core Web Vitals barely moved: LCP and INP by 8 ms or less, and CLS not at all. That's noise. Event Timing rounds each tap's duration to 8 ms, and LCP moves about that much from load to load. One other number got worse for a while: when Add to cart starts working, in step 1. Step 4 won it back. The step picker has every version's numbers, if you want to check.
Read this table across: each row is one step.
| Step | Which tool found the cause? | What changed? | Which lesson taught it? |
|---|---|---|---|
| Step 1: LCP | The LCP breakdown. It showed the download first, then the render delay. | A lighter picture, then defer on app.js. | Lessons 17.2, 17.4 and 18.5. |
| Step 2: CLS | The shift's attribution: what moved, how far, and when. | min-height keeps the promotion's room. | Lessons 30.2, 30.3 and 30.4. |
| Step 3: INP | INP's three parts, then the flame chart under the click. | A tap only updates the cart. | Lessons 26.2, 26.3 and 27.3. |
| Step 4: third parties | The 3rd parties insight. It named the chat widget's site. | A facade loads the widget on a tap. | Lessons 24.1 and 24.2. |
The field, after the project
Then the same 120 visitors met the finished store. Here are their p75s, before and after:
All three are good now. LCP went from 3,508 ms to 448 ms, INP from 344 ms to 48 ms, and CLS from 0.14 to 0. Pick phones or computers to see each group on its own:
All visits- LCP before3,508 ms
- LCP after448 ms
- INP before344 ms
- INP after48 ms
- CLS before0.14
- CLS after0
The p75 of 120 visits before the project, and of the same visitors' 120 visits after it. Passing means all three p75s are good.
Before, 84 of the 120 visits were over at least one line. After, none were. Why it matters: that's the number the owner cares about. It counts visitors, not milliseconds.
The report
Ravi writes it up the way lesson 40.2 taught. The answer comes first. Then the findings, the actions, how he'll know it stays fixed, and how he measured:
# Speed project: the Leaf and Kettle store## SummaryThe store now passes all three Core Web Vitals. Before, it failed all three.Four steps did it: 19 changed lines of code, and one lighter picture.## FindingsLCP: one visit in four waited 3.5 s or more for the picture. Now 0.4 s.CLS: 0.14 at p75, from a late promotion that pushed the page down 120 px. Now 0.INP: one tap in four took 344 ms or more. Now 48 ms.The chat widget cost every visit 129 KB and 447 ms of main-thread work.## ActionsDone: a lighter picture, defer, room for the promotion, a lighter tap, a chat facade.Next, Meera, day 5: split app.js, so Add to cart works sooner.## How we'll know it stays fixedEach week, read the p75s from our RUM, and alert if one goes over its line.## How we measured120 simulated visitors, before and after. Lab: Chrome 157, Slow 4G, CPU 4×, middle of 5 loads.- Line 1 is the title.
- Lines 2 to 4 are the summary: what changed, and what it cost.
- Lines 5 to 9 are the findings: one problem per line, with its numbers.
- Lines 10 to 12 are the actions: what's done, and what comes next, with a name and a day.
- Lines 13 and 14 say how he'll know it stays fixed.
- Lines 15 and 16 say how he measured. They come last, because only engineers need them.
Line 12 is honest about what's left. app.js is still 153 KB, mostly the 1,800-tea catalog. Add to cart only works once it has arrived. Splitting it is the next job (lesson 22.4).
One thing the report can't say yet: whether a faster store sells more tea. That takes an experiment with real visitors, as lesson 40.3 showed.
Which step fixes it?
Each problem below is one the project met. Sort it into the step that fixes it:
- The picture weighs 580 KB because of a texture of tiny dots
- The picture has arrived, but a script in the head hasn't run yet
- A promotion appears above the page a second after it's ready
- An empty box gets taller when its content arrives
- A tap sorts 200,000 prices that didn't change
- A tap redraws 1,800 teas when only the cart changed
- A chat widget from another site downloads on every visit
- Code from another site keeps the main thread busy during the load
Sort each problem into the step of the project that fixes it.
Common mix-ups
- "Fixing everything at once saves time." No. With one change per measurement, you know what each change did. The LCP step needed two changes, and each one showed the next problem.
- "If the lab passes, the field passes." No. The lab is one phone on one network. Google rates the p75 of real visits, on every phone and network.
- "The lab is always faster than real visitors." No. Here the lab's LCP was slower than the field's p75, because its network is slower than most visitors'.
- "An async third-party script costs nothing." No. It still downloads, and it still runs on the main thread. The chat widget cost 129 KB and 447 ms on every visit.
- "A tool's insight always names the cause." No. The layout shift insight blamed the picture. The time of the jump and the element that moved pointed at the promotion.
- "A Core Web Vital that passes means the page has no problems left." No. After all three passed, the widget still kept the main thread busy, and Add to cart still waited for 153 KB of script.
Practice exercises
Answer first, then use the hints. The DevTools exercises use the two traces the course published.
Another store measured these p75s. What does line 6 print?
// Another store's p75s, made up for this exercise
const p75 = { LCP: 2400, INP: 210, CLS: 0.05 };
const good = { LCP: 2500, INP: 200, CLS: 0.1 };

const over = Object.keys(p75).filter((metric) => p75[metric] > good[metric]);
console.log(`Over the line: ${over.join(", ") || "none"}`);
console.log(over.length ? "The store fails Core Web Vitals." : "The store passes Core Web Vitals.");Over the line: INP. LCP and CLS are under their lines, so only INP is over, and the store fails.
In the step picker, pick Before. How many long tasks ran during the load?
5. The store's start-up work, the chat widget's two tasks, and two more after the heavy picture arrived, before it appeared on screen.
These are the four parts with the lighter picture, before defer. What does the program print?
// The four parts with the lighter picture, before defer (ms)
const parts = {
  "time to first byte": 563.6,
  "resource load delay": 43.3,
  "resource load duration": 604.7,
  "element render delay": 1176.4,
};
const biggest = Object.keys(parts).reduce((a, b) => (parts[a] >= parts[b] ? a : b));
console.log(`Biggest part: ${biggest}, ${parts[biggest]} ms`);Biggest part: element render delay, 1176.4 ms. The download got small, so the wait for app.js became the biggest part.
How many lines did the INP step remove from app.js?
3: the comment, buildIndex() and showTeas(catalog.length). Nothing was added.
Open the before trace in DevTools' Performance panel. How many requests did the store send to chat.example?
2: widget.js, then settings.json. The widget asks for its settings only after its script has run.
In the before trace, which file did the browser ask for first, after the HTML itself?
styles.css. Its link comes first in the head, so the browser asks for it before app.js, the picture and the widget.
Check your understanding
For each question, ask yourself which step it's about, and which tool found the cause.
Question 1 of 7Why does the project change only one thing between two measurements?
Choose an answer to see the explanation.
Question 2 of 7With the lighter picture, the biggest part of LCP became the element render delay. What was the picture waiting for?
Choose an answer to see the explanation.
Question 3 of 7Which tool pointed at buildIndex and showTeas as the cause of the slow tap?
Choose an answer to see the explanation.
Question 4 of 7The third-party step barely moved LCP in the lab. Why was it still worth doing?
Choose an answer to see the explanation.
Question 5 of 7Why does the report judge the store by the p75 of many visits, not by the lab's middle load?
Choose an answer to see the explanation.
Question 6 of 7On a computer screen, the promotion is shorter than the room the CLS step keeps. What happens when it arrives?
Choose an answer to see the explanation.
Question 7 of 7What does the first line of this check print?
Read the code, then predict// Another store's p75s, made up for this question const p75 = { LCP: 2300, INP: 180, CLS: 0.12 }; const good = { LCP: 2500, INP: 200, CLS: 0.1 }; const over = Object.keys(p75).filter((metric) => p75[metric] > good[metric]); console.log(`Over the line: ${over.join(", ") || "none"}`); console.log(over.length ? "The store fails Core Web Vitals." : "The store passes Core Web Vitals.");Choose an answer to see the explanation.
Key takeaways
- Take a baseline first: the middle of several lab loads, and the p75 of many field visits.
- Work in a loop: measure, find the cause with the right tool, change one thing, measure again.
- The LCP breakdown, INP's parts, a shift's moved elements and the 3rd parties insight each point at one fix.
- One fix can show the next problem: the lighter picture showed the script in the head.
- Count what the vitals miss: a third party's bytes and its main-thread time.
- Report the before and after with the answer first, and say what's left.
Remember the one-liner.
Measure, find the cause, change one thing, measure again; then show the before and after.
Sources
The facts on this page come from these standards and docs:
- Web Vitals, web.dev.
- web-vitals, Google Chrome on GitHub.
- Optimize Largest Contentful Paint, web.dev.
- LCP breakdown, Chrome DevTools docs, performance insights.
- The script element: the defer attribute, WHATWG, HTML Standard.
- Optimize Cumulative Layout Shift, web.dev.
- Layout shift culprits, Chrome DevTools docs, performance insights.
- layout_image.cc: IsUnsizedImage (Chromium 157.0.8103.52), Chromium source.
- Optimize Interaction to Next Paint, web.dev.
- 3rd parties, Chrome DevTools docs, performance insights.
- Lazy load third-party resources with facades, Chrome for Developers.
Coming next: Project: build a RUM dashboard. You'll collect numbers like this project's field data from real visits, and chart them by segment.